PROTECTED SOURCE SCRIPT
Gann Square-of-9 Levels (Daily)
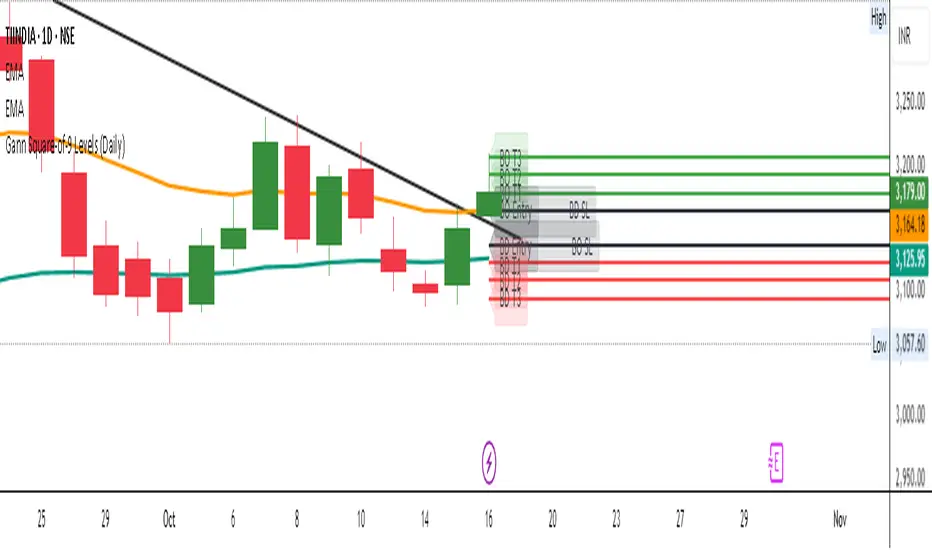
Gann Square-of-9 Levels (Daily) is a precision-based intraday and swing tool inspired by W.D. Gann’s Square of 9 spiral mathematics — one of the oldest and most powerful market geometry concepts.
This indicator automatically calculates dynamic support and resistance zones using the previous day’s close as the reference point. It derives upward and downward projections from that base using the Square-of-9 rotation logic, spaced at 45° (1/8th) increments of the Gann spiral.
The result is a clean, automatic grid of Breakout (BO) and Breakdown (BD) levels — complete with 3 upside and 3 downside targets, along with respective stop-loss lines for both directions.
Perfect for traders who follow Gann-based price projection, vibration levels, or natural market harmonics.
The indicator reads previous day’s close (from the daily timeframe).
Applies Square-of-9 root progression:
√Price ± (1/8, 2/8, 3/8, 4/8)… then squared again → to get harmonic price levels.
Automatically draws breakout and breakdown grids for the current day.
Redraws levels each new day with full label refresh.
Displayed Levels
Breakout Side (Upside Levels)
BO Entry → Trigger above previous day’s close
BO T1, T2, T3 → Profit targets
BO SL → Stop-loss line
Breakdown Side (Downside Levels)
BD Entry → Trigger below previous day’s close
BD T1, T2, T3 → Downside targets
BD SL → Stop-loss line
Built-in Alerts
🚀 Breakout Cross Alert → Triggers when price crosses above BO Entry.
⚠️ Breakdown Cross Alert → Triggers when price crosses below BD Entry.
Use these for automated long/short notifications directly on TradingView.
🧩 User Instructions
1️⃣ Add to chart — Works best on intraday or lower timeframes while referencing daily close.
2️⃣ Interpretation:
Long bias → Price crosses BO Entry upward.
Short bias → Price crosses BD Entry downward.
3️⃣ Use the Levels:
Targets act as measured move projections.
Stop-loss lines mark the opposite side’s entry.
4️⃣ Optional: Combine with moving averages or momentum tools for confirmation.
5️⃣ Daily Reset: Levels automatically refresh with each new trading day.
⚠️ Disclaimer
This indicator is for educational and analytical purposes only.
It is not financial advice. Always confirm signals with your trading plan and manage risk appropriately.
Script protetto
Questo script è pubblicato come codice protetto. Tuttavia, è possibile utilizzarlo liberamente e senza alcuna limitazione – per saperne di più clicca qui.
Declinazione di responsabilità
Le informazioni ed i contenuti pubblicati non costituiscono in alcun modo una sollecitazione ad investire o ad operare nei mercati finanziari. Non sono inoltre fornite o supportate da TradingView. Maggiori dettagli nelle Condizioni d'uso.