OPEN-SOURCE SCRIPT
V Pattern Trend
DESCRIPTION:
The V Pattern Trend Indicator is designed to identify and highlight V-shaped reversal patterns in price action. It detects both bullish and bearish V formations using a five-candle structure, helping traders recognize potential trend reversal points. The indicator filters out insignificant patterns by using customizable settings based on ATR, percentage, or points, ensuring that only meaningful V patterns are displayed.
CALCULATION METHOD
The user can choose how the minimum length of a V pattern is determined. The available options are:
ATR SETTINGS
PERCENTAGE THRESHOLD
- Sets a minimum percentage difference between the V high and V low for a pattern to be considered valid.
POINTS THRESHOLD
- Defines the minimum price movement (in points) required for a V pattern to be considered significant.

PATTERN VISUALIZATION
UNDERSTANDING V PATTERNS
A V pattern is a sharp reversal formation where price moves strongly in one direction and then rapidly reverses in the opposite direction, forming a "V" shape on the chart.
BULLISH V PATTERN
Pine Script®

BEARISH V PATTERN
Pine Script®

HOW THIS IS UNIQUE
HOW TRADERS CAN USE THIS INDICATOR
The V Pattern Trend Indicator is designed to identify and highlight V-shaped reversal patterns in price action. It detects both bullish and bearish V formations using a five-candle structure, helping traders recognize potential trend reversal points. The indicator filters out insignificant patterns by using customizable settings based on ATR, percentage, or points, ensuring that only meaningful V patterns are displayed.
CALCULATION METHOD
The user can choose how the minimum length of a V pattern is determined. The available options are:
- - ATR (Average True Range) – Filters V patterns based on ATR, making the detection adaptive to market volatility.
- - Percentage (%) – Considers V patterns where the absolute price difference between the V low and V high is greater than a user-defined percentage of the V high.
- - Points – Uses a fixed number of points to filter valid V patterns, making it useful for assets with consistent price ranges.
ATR SETTINGS
- - ATR Length – Defines the number of periods for ATR calculation.
- - ATR Multiplier – Determines the minimum V length as a multiple of ATR.
PERCENTAGE THRESHOLD
- Sets a minimum percentage difference between the V high and V low for a pattern to be considered valid.
POINTS THRESHOLD
- Defines the minimum price movement (in points) required for a V pattern to be considered significant.
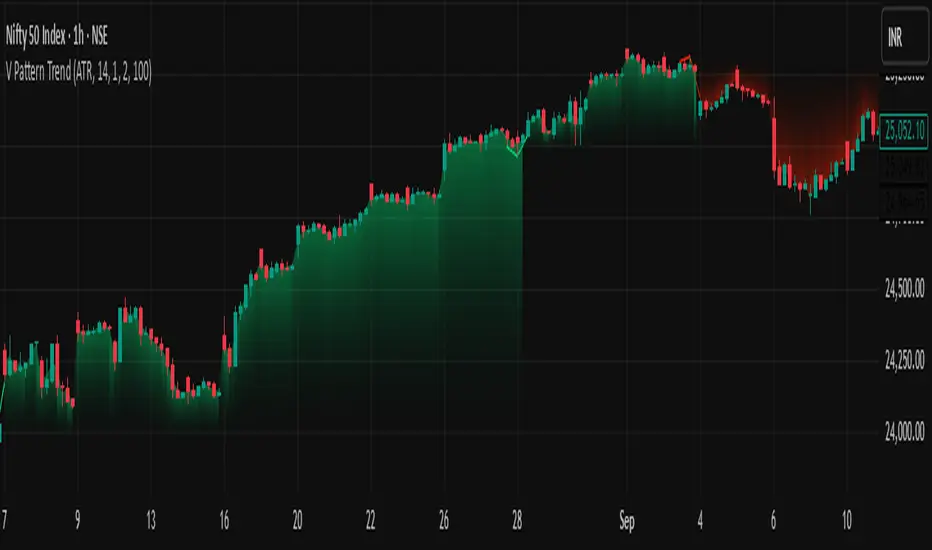
PATTERN VISUALIZATION
- - A bullish V pattern is plotted using two upward-sloping lines, with a filled green region to highlight the formation.
- - A bearish V pattern is plotted using two downward-sloping lines, with a filled red region to indicate the reversal.
- - The indicator dynamically updates and marks only the most recent valid patterns.
UNDERSTANDING V PATTERNS
A V pattern is a sharp reversal formation where price moves strongly in one direction and then rapidly reverses in the opposite direction, forming a "V" shape on the chart.
BULLISH V PATTERN
- - A bullish V pattern is formed when the price makes three consecutive lower lows, followed by two consecutive higher lows.
- - The pattern is confirmed when the highest high of the formation is greater than the previous highs within the structure.
- - This pattern suggests a potential trend reversal from bearish to bullish.
- - The lowest point of the pattern represents the V low, which acts as a support level.
bull_five_candle_v = low[4] > low[3] and low[3] > low[2] and low[1] > low[2] and low > low[1]
and high[4] > math.max(high[3], high[2], high[1]) and high > math.max(high[3], high[2], high[1])
BEARISH V PATTERN
- - A bearish V pattern is detected when the price makes three consecutive higher highs, followed by two consecutive lower highs.
- - The pattern is confirmed when the lowest low of the formation is lower than the previous lows within the structure.
- - This pattern signals a possible trend reversal from bullish to bearish.
- - The highest point of the pattern represents the V high, which acts as a resistance level.
bear_five_candle_v = high[4] < high[3] and high[3] < high[2] and high[1] < high[2] and high < high[1]
and low[4] < math.min(low[3], low[2], low[1]) and low < math.min(low[3], low[2], low[1])
HOW THIS IS UNIQUE
- - Advanced Filtering Mechanism – Unlike basic reversal indicators, this tool provides customizable filtering based on ATR, percentage, or points, ensuring that only significant V patterns are displayed.
- - Enhanced Visual Clarity – The indicator uses color-coded fills and structured plotting to make reversal patterns easy to recognize.
- - Works Across Market Conditions – Adaptable to different market environments, filtering out weak or insignificant price fluctuations.
- - Multi-Timeframe Usability – Can be applied across different timeframes and asset classes, making it useful for both intraday and swing trading.
HOW TRADERS CAN USE THIS INDICATOR
- - Identify potential trend reversals early based on structured price action.
- - Filter out weak or insignificant reversals to focus only on strong V formations.
- - Use the V pattern’s highs and lows as key support and resistance zones for trade entries and exits.
- - Combine with other indicators like moving averages, trendlines, or momentum oscillators for confirmation.
Script open-source
Nello spirito di TradingView, l'autore di questo script lo ha reso open source, in modo che i trader possano esaminarne e verificarne la funzionalità. Complimenti all'autore! Sebbene sia possibile utilizzarlo gratuitamente, ricordiamo che la ripubblicazione del codice è soggetta al nostro Regolamento.
Shivam mandai
Declinazione di responsabilità
Le informazioni e le pubblicazioni non sono intese come, e non costituiscono, consulenza o raccomandazioni finanziarie, di investimento, di trading o di altro tipo fornite o approvate da TradingView. Per ulteriori informazioni, consultare i Termini di utilizzo.