OPEN-SOURCE SCRIPT
Trailing Sharpe Ratio
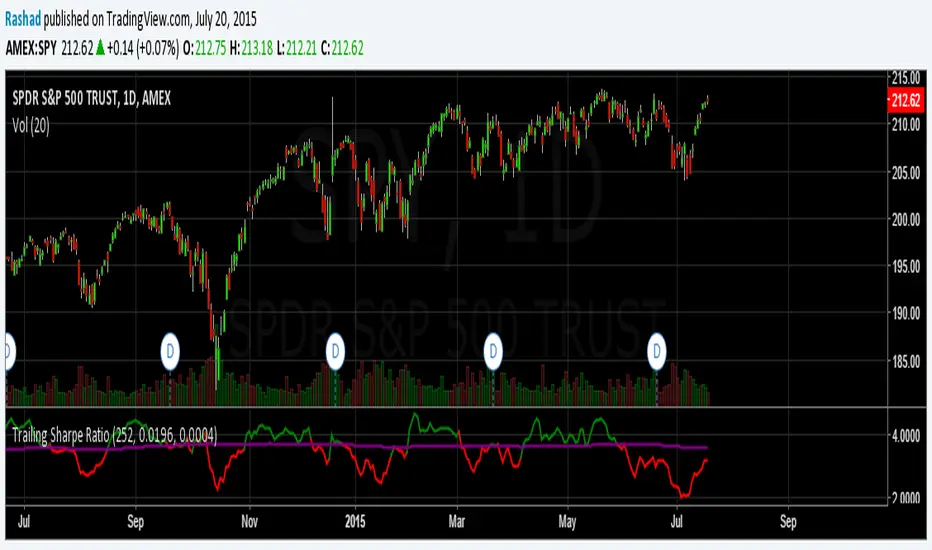
The Sharpe ratio allows you to see whether or not an investment has historically provided a return appropriate to its risk level. A Sharpe ratio above one is acceptable, above 2 is good, and above 3 is excellent. A Sharpe ratio less than one would indicate that an investment has not returned a high enough return to justify the risk of holding it. Interesting in this example, SPY's one year avg Sharpe ratio is above 3. This would mean on average SPY returns 3x better returns than the risk associated with holding it, implying there is some sort of underlying value to the investment.
When the sharpe ratio is above its signal, this implies the investment is currently outperforming compared to its typical return, below the signal means the investment is currently under performing. A negative Shape would mean that the investment has not provided a positive return, and may be a possible short candidate.
When the sharpe ratio is above its signal, this implies the investment is currently outperforming compared to its typical return, below the signal means the investment is currently under performing. A negative Shape would mean that the investment has not provided a positive return, and may be a possible short candidate.
Script open-source
In pieno spirito TradingView, il creatore di questo script lo ha reso open-source, in modo che i trader possano esaminarlo e verificarne la funzionalità. Complimenti all'autore! Sebbene sia possibile utilizzarlo gratuitamente, ricorda che la ripubblicazione del codice è soggetta al nostro Regolamento.
Declinazione di responsabilità
Le informazioni ed i contenuti pubblicati non costituiscono in alcun modo una sollecitazione ad investire o ad operare nei mercati finanziari. Non sono inoltre fornite o supportate da TradingView. Maggiori dettagli nelle Condizioni d'uso.