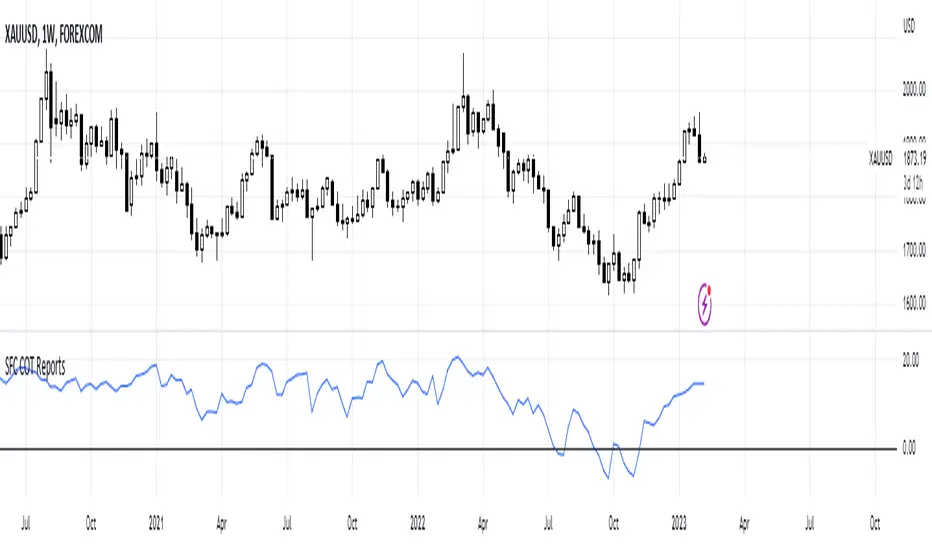
SFC True COT Reports
This indicator can display three similar, but also very different calculations:
- Net positions of the leveraged/managed Money
- COT Index
- COT True Index
Net Positions
The COT report is not a timing instrument. It shows us markets in which the trend remains stable OR where there could be a change in trend. But it does not give us clear information as to *WHEN* an entry into the market should take place.
Net positions are showing if the professional traders have bullish or bearish bias.
COT Index
After calculating the net positions, we are already one step further, but have not yet reached our goal. The net position itself does not tell us anything about how the commercials have actually positioned themselves. If we only know that the commercials are 15,782 contracts short this week, that does not help us much.
We need an indicator that lets us evaluate this figure. And we get it by relating the current position to the positions over a certain period. So, an index is calculated, that allows us to evaluate the current position as a percentage.
COT True Index
COT Index can give us very good idea how bullish or bearish are the professional traders, but it is limit to 0% and 100%. In this case an additional calculation is needed in order to remove this limitation and show us the true bias.
How to use the true index:
1) If the curve is below zero line means that the traders officially changed the bias from bullish to bearish . Before that we can consider that they are still bullish and price is retracing or consolidation, and vice versa
2) We can also measure the strength of the bias. For example if the curve is below zero line, but only few precent, we may consider that the bias is changing but it is still weak bearish bias.
3) We can use the chart to see where are the peaks and troughs. They are using as support and resistance and we can expect a general chance at these levels.
Supported pairs:
'XAUUSD' , 'XAGUSD' , 'COPPER' , 'PLATINUM' 'PALLADIUM';
'AUDUSD' ,'USDCAD' , 'GBPUSD' , 'EURUSD' , 'USDJPY' , 'DXY';
'US30USD' ,'SPX500USD' , 'NAS100USD';
'US02Y' , 'US05Y' , 'US10Y'
'BTCUSD'
Note: The curve of the US Yields is inverted, because actually shows the Bond market and not the Yields. This is not a problem, because Yields have perfect negative correlations with Bonds.
The indicator works only on weekly time frame.
Script su invito
Solo gli utenti approvati dall'autore possono accedere a questo script. È necessario richiedere e ottenere l'autorizzazione per utilizzarlo. Tale autorizzazione viene solitamente concessa dopo il pagamento. Per ulteriori dettagli, seguire le istruzioni dell'autore riportate di seguito o contattare direttamente SerpentForexClub.
TradingView NON consiglia di acquistare o utilizzare uno script a meno che non si abbia piena fiducia nel suo autore e se ne comprenda il funzionamento. È inoltre possibile trovare alternative gratuite e open source nei nostri script della community.
Istruzioni dell'autore
Declinazione di responsabilità
Script su invito
Solo gli utenti approvati dall'autore possono accedere a questo script. È necessario richiedere e ottenere l'autorizzazione per utilizzarlo. Tale autorizzazione viene solitamente concessa dopo il pagamento. Per ulteriori dettagli, seguire le istruzioni dell'autore riportate di seguito o contattare direttamente SerpentForexClub.
TradingView NON consiglia di acquistare o utilizzare uno script a meno che non si abbia piena fiducia nel suo autore e se ne comprenda il funzionamento. È inoltre possibile trovare alternative gratuite e open source nei nostri script della community.