OPEN-SOURCE SCRIPT
Aggiornato Custom Grid Lines
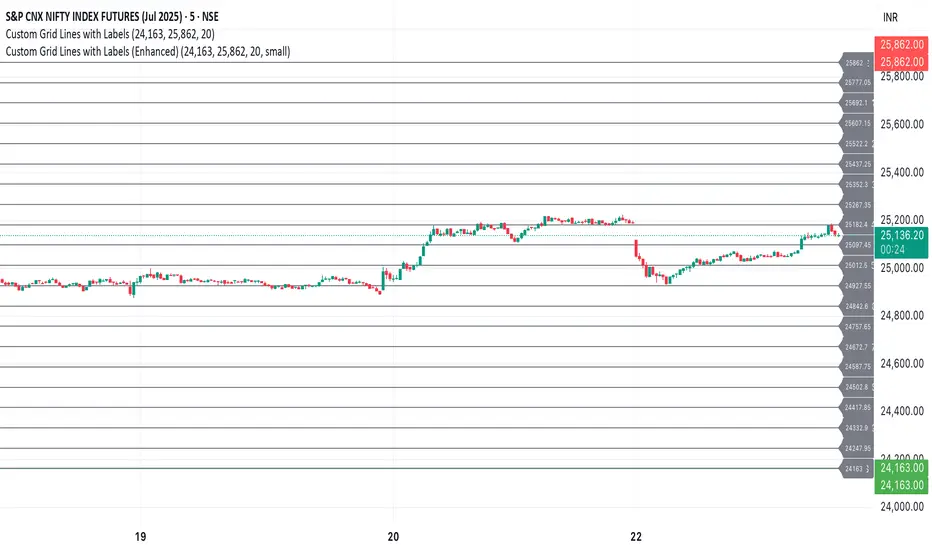
The Custom Grid Lines Indicator is a versatile tool designed for traders who want to manually define key price zones and visualize them with precision. This indicator allows users to select their own starting and ending price levels and automatically divides the range into user-defined grids using horizontal lines.
🔧 Key Features:
📍 User-Controlled Price Range:
Manually set the starting (bottom) and ending (top) price levels based on your trading plan, key zones, or market structure.
📊 Flexible Grid Setup:
Easily choose the number of grid lines to divide your selected range into equal price intervals.
📏 Automatic Grid Calculation:
The indicator calculates grid spacing and plots horizontal lines at each level, providing a clean and structured visual guide.
✅ Simple and Effective Visualization:
Ideal for grid trading, manual support/resistance plotting, or price zone tracking.
⚙️ How to Use:
Input the desired starting price (bottom of your range).
Input the ending price (top of your range).
Select the number of grids you want between these two levels.
The indicator will automatically draw all grid lines across your chart.
💡 Best For:
Grid Trading Strategies
Visualizing Custom Price Zones
Manual Support and Resistance Mapping
Session-Based Trading Ranges
Note di rilascio
Script Overview: Custom Grid Lines with LabelsThis TradingView Pine Script creates custom horizontal grid lines across the price chart within a user-defined range. Each grid line is labeled with its corresponding price level. The grid dynamically updates if the user changes the input values.
Key Features:
📌 User Inputs:
Starting Price: The bottom of the grid range.
Ending Price: The top of the grid range.
Number of Grids: How many grid levels to display.
📏 Automatic Spacing Calculation:
The script calculates the distance between each grid line based on the total price range and the number of grids.
🟦 Grid Lines and Labels:
Horizontal lines are drawn across the entire chart, from the far left to the far right.
Each line is labeled with its price value on the left side.
Both the grid lines and labels are stored in arrays for easy updating.
🔄 Dynamic Updates:
If the user changes the startPrice, endPrice, or numGrids, the lines and labels automatically adjust to the new levels.
🟢🔴 Start and End Price Highlights:
The starting price is plotted as a green line.
The ending price is plotted as a red line.
How It Works:
On the First Bar:
The script calculates the grid levels.
It draws horizontal lines at each grid level.
It creates labels showing the price at each grid level.
On Subsequent Bars:
The script continuously updates the position of the grid lines and labels to accommodate any changes in user inputs.
Practical Use Case:
This is especially useful for traders who:
Want to visualize price ranges or zones (for example, support/resistance levels).
Prefer to work with grid trading strategies or need fixed reference points on the chart.
Like clean and dynamic labeling that stays updated automatically.
📢 Summary:
"Custom Grid Lines with Labels" is a helpful visual tool for adding evenly spaced price levels to a chart, with live labels that keep track of each level as the chart progresses. It is fully customizable and auto-updating based on user input.
Note di rilascio
options given for -Label Font Size
-Label Background Color
-Label Text Color
Script open-source
Nello spirito di TradingView, l'autore di questo script lo ha reso open source, in modo che i trader possano esaminarne e verificarne la funzionalità. Complimenti all'autore! Sebbene sia possibile utilizzarlo gratuitamente, ricordiamo che la ripubblicazione del codice è soggetta al nostro Regolamento.
Declinazione di responsabilità
Le informazioni e le pubblicazioni non sono intese come, e non costituiscono, consulenza o raccomandazioni finanziarie, di investimento, di trading o di altro tipo fornite o approvate da TradingView. Per ulteriori informazioni, consultare i Termini di utilizzo.