OPEN-SOURCE SCRIPT
Aggiornato Real-Time Open Levels with Labels + Info Table
Real-Time Multi-Timeframe Open Levels with Labels & Info Panel
Overview
This indicator displays real-time opening price levels across multiple timeframes (Monthly, Weekly, Daily, 4H) directly on your chart. It features:
• Dynamic horizontal lines extending through each timeframe period
• Customizable labels with text/colors
• Special 4H line treatment for the last hour (5-min charts only)
• Integrated information panel showing symbol, timeframe, and price changes

*Example showing multiple timeframe levels with labels and info panel*
---
Features & Configuration
1. Monthly Settings

Show Monthly: Toggle visibility of monthly opening price
Color: Semi-transparent blue (#2196F3 at 70% opacity)
Width: 2px line thickness
Style: Solid/Dotted/Dashed
Label: Display "M-Open" text with white text on blue background
2. Weekly Settings

Show Weekly: Toggle weekly opening price visibility
Color: Semi-transparent red (#FF5252 at 70% opacity)
Width: 1px thickness
Style: Dotted by default
Label: "W-Open" text in white on red background
3. Daily Settings

Show Daily: Toggle daily opening price
Color: Amber (#FFA000 at 70% opacity)
Width: 2px thickness
Style: Solid
Label: "D-Open" in white on orange background
---
4. 4-Hour Settings (5-Minute Charts Only)
Special Features for 5-Min Timeframe:
1. Standard 4H Line
• First 3 hours: Green (#4CAF50) dashed line
• Last hour: Bright red solid line (configurable)
• Vertical divider between 3rd/4th hours
2. Configuration Options
• Main 4H Line:
◦ Color/Width/Style for initial 3 hours
◦ Toggle label ("H4-Open") visibility and styling
• Final Hour Enhancement:
*Last Hour Line*
◦ Unique red color and line style
◦ Separate width (1px) and style (Solid)
*Divider Line*
◦ Vertical red dotted line marking last hour
◦ Adjustable position/width/transparency

*4H levels showing 3-hour segment and final hour treatment*
---
5. Info Panel Settings
Positioning:
• Anchor to any chart corner (Top/Bottom + Left/Right combinations)
• Three text sizes: Title (Huge), Change % (Large), Signature (Small)
Display Elements:
• Symbol: Show exchange prefix (e.g., "NASDAQ:")
• Timeframe: Current chart period (e.g., "5m")
• Change %: 24-hour price movement ▲/▼ percentage
• Custom Signature: Add text/username in footer
Styling:
• Semi-transparent white text (#ffffff77)
• Currency pair formatting (e.g., BTC/USD vs BTC-USD)

*Sample info panel with all elements enabled*
---
Usage Tips
1. Multi-Timeframe Context: Use levels to identify key daily/weekly support/resistance
2. 4H Trading: On 5-min charts, watch for price reactions near final hour transition
3. Customization:
• Match line colors to your chart theme
• Use different labels for clarity (e.g., "Weekly Open")
• Disable unused elements to reduce clutter
4. Divider Lines: Helps identify institutional trading periods (hour closes)
---
*Created using Pine Script v6. For optimal performance, use on charts <1H timeframe. [Get this script on TradingView]()*
[Documentation version 1.0 - Updated 2024-03-15]
Note di rilascio
English User Manual Update - ADR Feature Enhancement ---
**Version Update Summary**
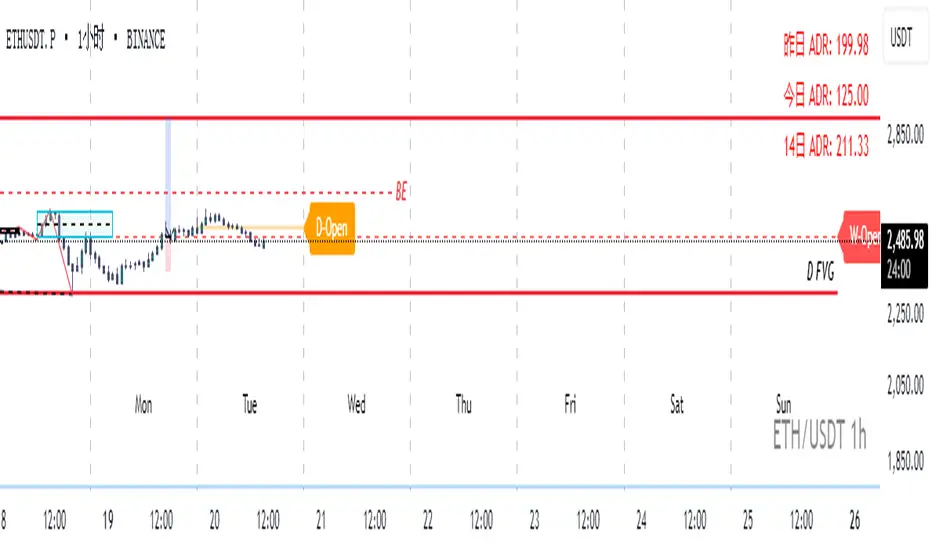
This update introduces the ADR (Average Daily Range) feature, providing dynamic volatility analysis with customizable display options. The indicator now supports multi-timeframe open price levels with enhanced visual controls and an integrated ADR information panel.
---
**New Features: ADR Settings**
**6. ADR Parameters**

*Access via indicator settings > "6. ADR Parameters"*
1. Show ADR Info
• Toggle visibility of the ADR panel.
• *Default: Enabled*
2. Calculation Period
• Set the lookback period (in days) for the average ADR calculation.
• *Range: 1–100 days | Default: 25*
3. Display Options
• Show Yesterday's ADR: Displays the previous day's price range.
• Show Today's ADR: Shows the current day's intraday range.
• Show Average ADR: Displays the smoothed ADR over the selected period.
• *All options enabled by default.*
4. Decimal Precision
• Adjust the number of decimals for ADR values.
• *Range: 0–6 | Default: 2*
---
**7. ADR Table Positioning**

*Access via indicator settings > "7. ADR Table Location"*
1. Vertical Position
• Choose `top`, `middle`, or `bottom` placement on the chart.
2. Horizontal Position
• Align to `left`, `center`, or `right`.
3. Text Customization
• Text Size: Options from `tiny` to `huge` (default: `small`).
• Text Color: Select any color (default: white).
---
**Example Use Cases**
1. Volatility Analysis:
• Compare today’s range (Today ADR) against the historical average (25-day ADR) to gauge market volatility.
2. Session Planning:
• Use the "Yesterday ADR" to identify potential support/resistance zones from the prior trading session.
3. Custom Alerts:
• Combine ADR data with price levels (e.g., daily opens) to set alerts for breakouts or reversals.
---
**Frequently Asked Questions (FAQ)**
Q1: Why does the ADR table not appear?
• Ensure `Show ADR Info` is enabled in settings (Section 6).
• Verify the chart’s timeframe is not monthly/weekly (ADR uses daily data).
Q2: How to reset ADR parameters?
• Right-click the indicator > *Settings* > Click `Restore Defaults`.
Q3: Can I change the ADR calculation period intraday?
• Yes—the `Calculation Period` updates dynamically.
---
**Compatibility Notes**
• Works on all assets with daily data (stocks, forex, crypto).
• Optimized for use with the existing multi-timeframe open levels (daily, weekly, monthly).
---
*Updated: 2024-03-05 | Version: 6.1 | By: [Your Name]*
For support, contact: [your.email@domain.com]
---
📌 Tip: Combine ADR levels with the 4H open lines (Section 4) for intraday trading strategies!
Note di rilascio
📣 New Feature Alert: Daily Division Lines + Weekday Labels! 🎉 Let’s break down this fun & functional update with a *sandwich-style* explanation (good news ➡ details ➡ encouragement)!
---
**🥪 Top Layer: POSITIVE HIGHLIGHTS 🚀**
"YAAAS! Time to visualize weeks like a pro!" 👏
• NEW! Crisp vertical lines split each week into Monday → Sunday segments! 📅
• CUTE labels (Mon, Tue, Wed…) at the chart’s bottom make timing crystal clear! 🏷️
• Perfect for spotting daily patterns or aligning trades with specific sessions (London/NY/Asia)! 🌍
---
**🥪 Middle Layer: KEY DETAILS & CUSTOMIZATION 🛠️**
✨ Features:
• Full-chart coverage: Lines stretch from top to bottom! 📈➡📉
• Styling freedom: Choose colors, widths, and dashed/dotted styles! 🎨
• Smart positioning: Labels auto-adjust to weekly lows + user-defined offsets! ⚙️
🔧 Customize in settings:
• Toggle lines/labels ON/OFF 🕹️
• Pick colors (with transparency!) 🌈
• Adjust label position with the “Label Bottom Offset” slider! 📏
---
**🥪 Bottom Layer: CHEERFUL CLOSING 🌟**
"Go forth and conquer those weekly charts!" 💪
• Pro Tip: Use these lines to spot overnight gaps or news-driven moves! 📰
• Got ideas? We’re all ears! 😊 (Slap a comment below or tweak the code!)
Happy trading! 🚀📊
*(P.S. Mondays just got a little less scary… right? 😉)*
---
🔍 Quick Demo: Imagine analyzing a bullish breakout on Wednesday—now you’ll instantly see if it aligns with the London session open! 🕒🐂
Script open-source
Nello spirito di TradingView, l'autore di questo script lo ha reso open source, in modo che i trader possano esaminarne e verificarne la funzionalità. Complimenti all'autore! Sebbene sia possibile utilizzarlo gratuitamente, ricordiamo che la ripubblicazione del codice è soggetta al nostro Regolamento.
Declinazione di responsabilità
Le informazioni e le pubblicazioni non sono intese come, e non costituiscono, consulenza o raccomandazioni finanziarie, di investimento, di trading o di altro tipo fornite o approvate da TradingView. Per ulteriori informazioni, consultare i Termini di utilizzo.