PROTECTED SOURCE SCRIPT
ICT Breaker Blocks
ICT Breaker Block Detector
This indicator automatically identifies and displays high-probability ICT (Inner Circle Trader) Breaker Blocks on your chart. It is designed to help traders spot key shifts in market structure where price is likely to react.
What It Does
The indicator's primary function is to find and draw both Bullish and Bearish Breaker Blocks. These are specific price action patterns that signal a potential reversal after a liquidity sweep.
Bullish Breaker Block (Green): Forms after a low is swept (creating a lower low) and the market structure shifts by breaking above the intermediate swing high. This broken swing high becomes the Bullish Breaker.
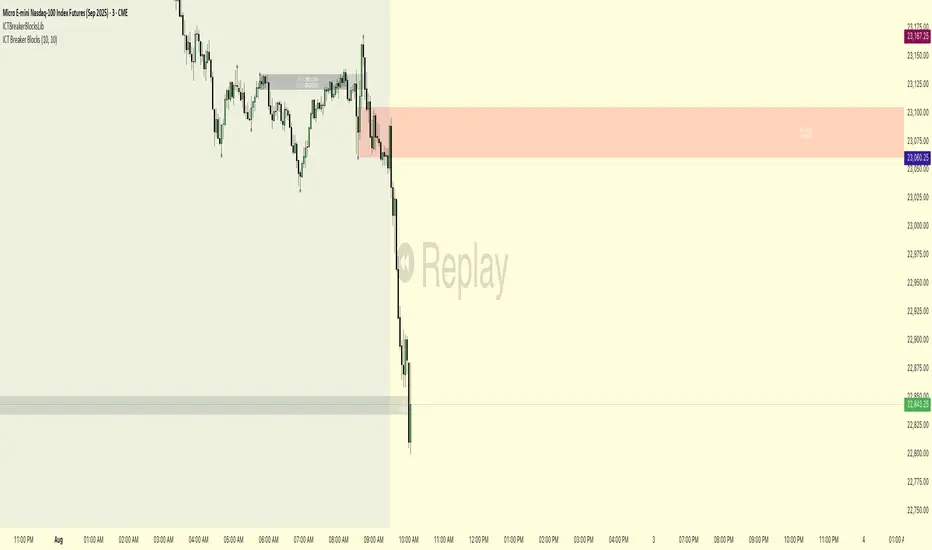
Bearish Breaker Block (Red): Forms after a high is swept (creating a higher high) and the market structure shifts by breaking below the intermediate swing low. This broken swing low becomes the Bearish Breaker.
Invalidation: The indicator also tracks these zones in real-time. If price trades completely through a breaker block, the zone is considered invalidated. It will stop extending, its color will change to gray, and an exclamation mark ! will be added to its label.
How It Functions
The script's logic is designed to precisely identify the ICT breaker pattern:
Liquidity Sweep: It first identifies a sequence where a recent swing high is taken out by a higher high (for a bearish setup) or a swing low is taken out by a lower low (for a bullish setup).
Market Structure Shift (MSS): After the sweep, it waits for a clear break in market structure. This occurs when price closes below the intermediate swing low (for a bearish breaker) or above the intermediate swing high (for a bullish breaker).
Drawing the Zone: Once the MSS is confirmed, the indicator draws a box around the range of the swing point that was broken. This box is the Breaker Block, which is then extended into the future to serve as a potential area of interest.
How to Use This Indicator
Settings
Pivot Lookback: This setting determines the sensitivity of the swing point detection. A higher number will identify larger, more significant market structure and result in fewer, but potentially stronger, breaker blocks. A lower number will identify smaller, more immediate patterns.
Color & Display Options: You can customize the colors for the bullish, bearish, and invalidated zones, as well as toggle the visibility of each type of breaker.
Trading Application
Traders can use these automatically drawn zones as high-probability Points of Interest (POI). The common application is to wait for price to return to the breaker block after it has formed. This retest can offer a potential entry opportunity in the direction of the market structure shift.
For a Bullish Breaker, a trader might look for a long entry when the price dips back into the green zone.
For a Bearish Breaker, a trader might look for a short entry when the price rallies back up into the red zone.
Disclaimer: This indicator is a tool to assist in technical analysis. It is not a standalone trading system and does not provide financial advice. Always use proper risk management and combine this tool with your own analysis and trading strategy.
This indicator automatically identifies and displays high-probability ICT (Inner Circle Trader) Breaker Blocks on your chart. It is designed to help traders spot key shifts in market structure where price is likely to react.
What It Does
The indicator's primary function is to find and draw both Bullish and Bearish Breaker Blocks. These are specific price action patterns that signal a potential reversal after a liquidity sweep.
Bullish Breaker Block (Green): Forms after a low is swept (creating a lower low) and the market structure shifts by breaking above the intermediate swing high. This broken swing high becomes the Bullish Breaker.
Bearish Breaker Block (Red): Forms after a high is swept (creating a higher high) and the market structure shifts by breaking below the intermediate swing low. This broken swing low becomes the Bearish Breaker.
Invalidation: The indicator also tracks these zones in real-time. If price trades completely through a breaker block, the zone is considered invalidated. It will stop extending, its color will change to gray, and an exclamation mark ! will be added to its label.
How It Functions
The script's logic is designed to precisely identify the ICT breaker pattern:
Liquidity Sweep: It first identifies a sequence where a recent swing high is taken out by a higher high (for a bearish setup) or a swing low is taken out by a lower low (for a bullish setup).
Market Structure Shift (MSS): After the sweep, it waits for a clear break in market structure. This occurs when price closes below the intermediate swing low (for a bearish breaker) or above the intermediate swing high (for a bullish breaker).
Drawing the Zone: Once the MSS is confirmed, the indicator draws a box around the range of the swing point that was broken. This box is the Breaker Block, which is then extended into the future to serve as a potential area of interest.
How to Use This Indicator
Settings
Pivot Lookback: This setting determines the sensitivity of the swing point detection. A higher number will identify larger, more significant market structure and result in fewer, but potentially stronger, breaker blocks. A lower number will identify smaller, more immediate patterns.
Color & Display Options: You can customize the colors for the bullish, bearish, and invalidated zones, as well as toggle the visibility of each type of breaker.
Trading Application
Traders can use these automatically drawn zones as high-probability Points of Interest (POI). The common application is to wait for price to return to the breaker block after it has formed. This retest can offer a potential entry opportunity in the direction of the market structure shift.
For a Bullish Breaker, a trader might look for a long entry when the price dips back into the green zone.
For a Bearish Breaker, a trader might look for a short entry when the price rallies back up into the red zone.
Disclaimer: This indicator is a tool to assist in technical analysis. It is not a standalone trading system and does not provide financial advice. Always use proper risk management and combine this tool with your own analysis and trading strategy.
Script protetto
Questo script è pubblicato come codice protetto. Tuttavia, è possibile utilizzarle liberamente e senza alcuna limitazione – ulteriori informazioni qui.
Declinazione di responsabilità
Le informazioni e le pubblicazioni non sono intese come, e non costituiscono, consulenza o raccomandazioni finanziarie, di investimento, di trading o di altro tipo fornite o approvate da TradingView. Per ulteriori informazioni, consultare i Termini di utilizzo.