OPEN-SOURCE SCRIPT
Aggiornato CPR Option Selling Strategy
Good afternoon traders,
This is a script I built for option selling, in attempt to have a high success rate.
The gist of how it works:
It uses the opening or close of the current chart's timeframe opening bar when referenced against a designated (higher) timeframe's central pivot range (CPR).
Using that comparison, this script calculates an option to sell: put, call, or iron condor. It will calculate a call value using an average of the CPR central pivot and the max value of the prior higher timeframe's high or R1 (whichever is higher.)
It does the same for the put side, but uses the higher timeframe's low or S1 (whichever is lower.)
It will use the option on the other side of the source (open or close) of the CPR as the "option in play."
Settings:
There are many settings, most are simply "viewable" settings, and probably self explanatory, others, not so much:
"Source for Trigger" - this is the value used on the "opening bar," such as the close. This value is the one compared to the Central Pivot Range in determining whether to sell a call (if the source is lower,) sell a put (if the source is higher,) or an iron condor if it's in the CPR.
"Show Historical Win/Loss Percentages" - this shows a table in the bottom right of the W/L percentages for the current ticker and settings. Used for a quick glance at historical success rates.
"Extend Developing Levels Into the Future" - This will extend the developing values for CPR values, call and put values into the future (good for trying to trade early or setting up pre-market trades, assuming there will not be huge gap in one direction or another.)
"Select Higher Timeframe" - "Auto" will choose the higher timeframe for you. "Manual" will use the next field...
"If Manual, Timeframe for Pivots" - allows you to choose a different higher timeframe.
The next two sections are simply whether to show the plots for different levels of traditional and/or camarilla pivot points.
The last section will allow you to just filter on certain days. Really only useful for "backtesting" certain 0DTE trades on some daily options during the hourly chart.
Example use:
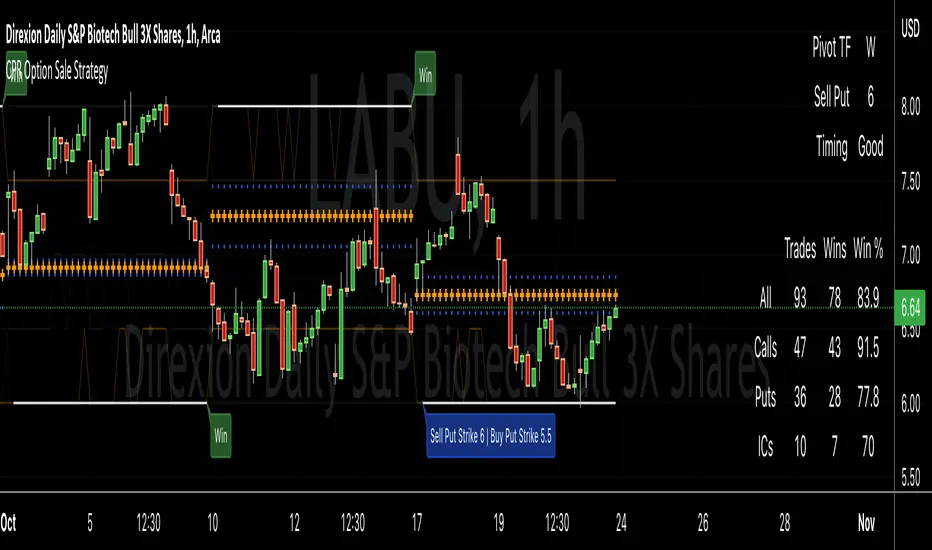
An example use (which I completed last week) on the chart referenced in this share: I sold a put-spread for $0.90, selling a 590 and buying a 570 strike in the middle of the week. I was looking at an hourly timeframe chart with a weekly pivot timeframe for the strategy.
Obviously, making only $0.90 on a $20 spread, there is a lot more to lose than to make, but I did some other analysis to go with it, so I felt safe, and I had a stop set for $1.50. So it worked, along with 3 other plays I did, very similar, and if that "Historical Win/Loss Percentage" is accurate, which I am fairly certain it is, I felt good about it.
The key all comes down to what you sell it for, right? That piece only you can determine. :)
Happy trading and enjoy,
Deuce
This is a script I built for option selling, in attempt to have a high success rate.
The gist of how it works:
It uses the opening or close of the current chart's timeframe opening bar when referenced against a designated (higher) timeframe's central pivot range (CPR).
Using that comparison, this script calculates an option to sell: put, call, or iron condor. It will calculate a call value using an average of the CPR central pivot and the max value of the prior higher timeframe's high or R1 (whichever is higher.)
It does the same for the put side, but uses the higher timeframe's low or S1 (whichever is lower.)
It will use the option on the other side of the source (open or close) of the CPR as the "option in play."
Settings:
There are many settings, most are simply "viewable" settings, and probably self explanatory, others, not so much:
"Source for Trigger" - this is the value used on the "opening bar," such as the close. This value is the one compared to the Central Pivot Range in determining whether to sell a call (if the source is lower,) sell a put (if the source is higher,) or an iron condor if it's in the CPR.
"Show Historical Win/Loss Percentages" - this shows a table in the bottom right of the W/L percentages for the current ticker and settings. Used for a quick glance at historical success rates.
"Extend Developing Levels Into the Future" - This will extend the developing values for CPR values, call and put values into the future (good for trying to trade early or setting up pre-market trades, assuming there will not be huge gap in one direction or another.)
"Select Higher Timeframe" - "Auto" will choose the higher timeframe for you. "Manual" will use the next field...
"If Manual, Timeframe for Pivots" - allows you to choose a different higher timeframe.
The next two sections are simply whether to show the plots for different levels of traditional and/or camarilla pivot points.
The last section will allow you to just filter on certain days. Really only useful for "backtesting" certain 0DTE trades on some daily options during the hourly chart.
Example use:
An example use (which I completed last week) on the chart referenced in this share: I sold a put-spread for $0.90, selling a 590 and buying a 570 strike in the middle of the week. I was looking at an hourly timeframe chart with a weekly pivot timeframe for the strategy.
Obviously, making only $0.90 on a $20 spread, there is a lot more to lose than to make, but I did some other analysis to go with it, so I felt safe, and I had a stop set for $1.50. So it worked, along with 3 other plays I did, very similar, and if that "Historical Win/Loss Percentage" is accurate, which I am fairly certain it is, I felt good about it.
The key all comes down to what you sell it for, right? That piece only you can determine. :)
Happy trading and enjoy,
Deuce
Note di rilascio
Updated this script with several changes. They are as follows.3 alerts were added and can be turned on in the settings.
Enable Standard Alert - send alert with the strike values when the next bar opens after the first bar in the pivot TimeFrame.
Enable Discord Alert - same as above, but formatted to go to a discord web hook. I use this, thus why it's in there.
Enable Price Zone Upgrade - alert for when a price is getting closer to the strike price (crossing top, central, or bottom of the CPR), so possibly could get more premium, but of course, more risk too.
All alerts are set to fire only once per bar, with the first two limited really only to bar 2 into the pivot timeframe (I think :) .)
I changed some label formatting to show both sides of a spread and to limit the labeling to only the most recent, to help declutter the chart.
I fixed a couple of calculations on the strike prices, as I was using some put values for call values on a couple misalignments.
Note di rilascio
A few small updates:- Added a manual spread setting to allow for a user inputted amount for the spread, per request of a couple of people.
- Added a couple more Pivot Timeframes to select from
- A small visual change here and there
Note di rilascio
Had a few requests about trying to get some more premium using this method of selling options, so I added a few options that would calculate the near strike a little closer...."Near Strike Calculation Source"
- Traditional Pivot S1/R1 : this is my original design and remains the default.
- Camarilla Pivot R1/S1 : as stated, uses Cam Pivot support and resistance 1
- Camarilla Pivot R2/S2 : as stated, uses Cam Pivot support and resistance 2
- Manual offset from Central Pivot Point : uses the Central Pivot Point value +/- this offset for the respective side of the trade
"Manual Offset Value" : the offset from the Central Pivot. Example:
The Central Pivot value is 100
The setting above is chosen for manual offset.
This setting is set to 20
Instead of using a pivot point support/resistance the value 20 is added or subtracted from the central pivot value, so 80 and 120 would be used for the respective side of the trade.
It's important to note, that some of the comparative logic is still used in order to maintain the the overall trade logic. So, sometimes manual changes won't do much, since current PivotTFHighs and Lows are used in part of the comparisons.
This should allow for more aggressive entries with some historical reference, so you can tweak your trading.
As you know...more premium, usually means more risk, which usually means a lesser winning percentage, but I have tested a few riskier trades with the Camarilla Pivot S1/R1, and this does accomplish the task of getting more premium, since those values are closer than the Traditional Pivot values when compared to the Central Pivot.
I hope it helps out a little for those who requested it.
Enjoy, and trade carefully.
Note di rilascio
A couple of minor updates:Added:
Settings to restrict the backtesting dates, to allow for "periodic" research, or something like that, per some requests that came in.
Ability to see prior day and week's highs and lows. Turned off by default (too much clutter for me).
Script open-source
In pieno spirito TradingView, il creatore di questo script lo ha reso open-source, in modo che i trader possano esaminarlo e verificarne la funzionalità. Complimenti all'autore! Sebbene sia possibile utilizzarlo gratuitamente, ricorda che la ripubblicazione del codice è soggetta al nostro Regolamento.
There is no market.
Declinazione di responsabilità
Le informazioni ed i contenuti pubblicati non costituiscono in alcun modo una sollecitazione ad investire o ad operare nei mercati finanziari. Non sono inoltre fornite o supportate da TradingView. Maggiori dettagli nelle Condizioni d'uso.