OPEN-SOURCE SCRIPT
[blackcat] L3 Dark Horse Oscillator
OVERVIEW
The [blackcat] L3 Dark Horse Oscillator is a sophisticated technical indicator meticulously crafted to offer traders deep insights into market momentum. By leveraging advanced calculations involving Relative Strength Value (RSV) and proprietary oscillatory techniques, this script provides clear and actionable signals for identifying potential buying and selling opportunities. Its distinctive feature—a vibrant gradient color scheme—enhances readability and makes it easier to visualize trends and reversals on the chart 📈↗️.
FEATURES
Advanced Calculation Methods: Utilizes complex algorithms to compute the Relative Strength Value (RSV) over specific periods, providing a nuanced view of price movements.
Default Period: 27 bars for initial RSV calculation.
Additional Period: 36 bars for extended RSV analysis.
Dual-Oscillator Components:
Component A: Derived using multiple layers of Simple Moving Averages (SMAs) applied to the RSV, offering a smoothed representation of short-term momentum.
Component B: Employs a unique averaging method tailored to capture medium-term trends effectively.
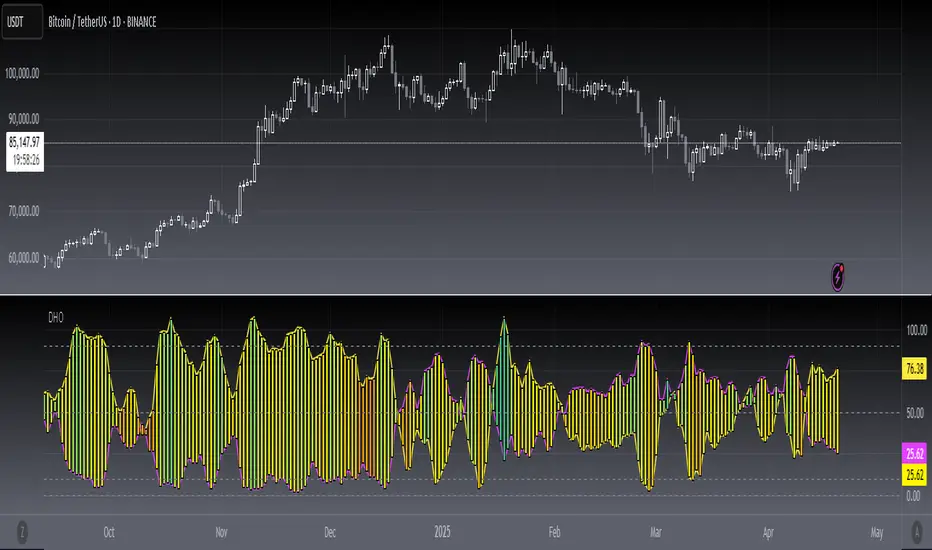
Dynamic Gradient Color Scheme: Enhances visualization through a spectrum of colors that change dynamically based on the calculated values, making trend identification intuitive and engaging 🌈.
Customizable Horizontal Reference Lines: Key levels are marked at 0, 10, 50, and 90 to serve as benchmarks for assessing the oscillator's readings, helping traders make informed decisions quickly.
Comprehensive Visual Representation: Combines the strengths of both components into a single, gradient-colored candlestick plot, providing a holistic view of market sentiment and momentum shifts 📊.
HOW TO USE
Adding the Indicator: Start by adding the [blackcat] L3 Dark Horse Oscillator to your TradingView chart via the indicators menu. This will overlay the necessary plots directly onto your price chart.
Interpreting the Components: Familiarize yourself with the two primary components represented by yellow and fuchsia lines. These lines indicate the underlying momentum derived from the RSV calculations.
Monitoring Momentum Shifts: Pay close attention to the gradient-colored candlesticks, which reflect the combined strength of both components. Notice how these candles transition through various shades, signaling changes in market dynamics.
Utilizing Reference Levels: Leverage the horizontal lines at 0, 10, 50, and 90 as critical thresholds. For instance, values above 50 might suggest bullish conditions, while those below could hint at bearish tendencies.
Combining with Other Tools: To enhance reliability, integrate this indicator with complementary technical analyses such as moving averages, volume profiles, or other oscillators like RSI or MACD.
LIMITATIONS
Market Volatility: In extremely volatile or sideways-trending markets, the indicator might produce false signals due to erratic price movements. Always cross-reference with broader market contexts.
Testing Required: Before deploying the indicator in real-time trading, conduct thorough backtesting across diverse assets and timeframes to understand its performance characteristics fully.
Asset-Specific Performance: The efficacy of the [blackcat] L3 Dark Horse Oscillator can differ significantly across various financial instruments and market conditions. Tailor your strategies accordingly.
NOTES
Historical Data: Ensure ample historical data availability to facilitate precise calculations and avoid inaccuracies stemming from insufficient data points.
Parameter Adjustments: Experiment with adjusting the default periods (27 and 36 bars) if you find them unsuitable for your specific trading style or market conditions.
Visual Customization: Modify the appearance settings, including line styles and gradient colors, to better suit personal preferences without compromising functionality.
Risk Management: While the indicator offers valuable insights, always adhere to robust risk management practices to safeguard against unexpected market fluctuations.
EXAMPLE STRATEGIES
Trend Following: Use the oscillator to confirm existing trends. When Component A crosses above Component B, consider entering long positions; conversely, look for short entries during downward crossovers.
Mean Reversion: Identify extreme readings near the upper (90) or lower (10) bands where prices might revert to mean levels, presenting potential reversal opportunities.
Divergence Analysis: Compare the oscillator's behavior with price action to spot divergences, which often precede trend reversals. Bullish divergence occurs when prices make lower lows but the oscillator shows higher lows, suggesting upward momentum.
The [blackcat] L3 Dark Horse Oscillator is a sophisticated technical indicator meticulously crafted to offer traders deep insights into market momentum. By leveraging advanced calculations involving Relative Strength Value (RSV) and proprietary oscillatory techniques, this script provides clear and actionable signals for identifying potential buying and selling opportunities. Its distinctive feature—a vibrant gradient color scheme—enhances readability and makes it easier to visualize trends and reversals on the chart 📈↗️.
FEATURES
Advanced Calculation Methods: Utilizes complex algorithms to compute the Relative Strength Value (RSV) over specific periods, providing a nuanced view of price movements.
Default Period: 27 bars for initial RSV calculation.
Additional Period: 36 bars for extended RSV analysis.
Dual-Oscillator Components:
Component A: Derived using multiple layers of Simple Moving Averages (SMAs) applied to the RSV, offering a smoothed representation of short-term momentum.
Component B: Employs a unique averaging method tailored to capture medium-term trends effectively.
Dynamic Gradient Color Scheme: Enhances visualization through a spectrum of colors that change dynamically based on the calculated values, making trend identification intuitive and engaging 🌈.
Customizable Horizontal Reference Lines: Key levels are marked at 0, 10, 50, and 90 to serve as benchmarks for assessing the oscillator's readings, helping traders make informed decisions quickly.
Comprehensive Visual Representation: Combines the strengths of both components into a single, gradient-colored candlestick plot, providing a holistic view of market sentiment and momentum shifts 📊.
HOW TO USE
Adding the Indicator: Start by adding the [blackcat] L3 Dark Horse Oscillator to your TradingView chart via the indicators menu. This will overlay the necessary plots directly onto your price chart.
Interpreting the Components: Familiarize yourself with the two primary components represented by yellow and fuchsia lines. These lines indicate the underlying momentum derived from the RSV calculations.
Monitoring Momentum Shifts: Pay close attention to the gradient-colored candlesticks, which reflect the combined strength of both components. Notice how these candles transition through various shades, signaling changes in market dynamics.
Utilizing Reference Levels: Leverage the horizontal lines at 0, 10, 50, and 90 as critical thresholds. For instance, values above 50 might suggest bullish conditions, while those below could hint at bearish tendencies.
Combining with Other Tools: To enhance reliability, integrate this indicator with complementary technical analyses such as moving averages, volume profiles, or other oscillators like RSI or MACD.
LIMITATIONS
Market Volatility: In extremely volatile or sideways-trending markets, the indicator might produce false signals due to erratic price movements. Always cross-reference with broader market contexts.
Testing Required: Before deploying the indicator in real-time trading, conduct thorough backtesting across diverse assets and timeframes to understand its performance characteristics fully.
Asset-Specific Performance: The efficacy of the [blackcat] L3 Dark Horse Oscillator can differ significantly across various financial instruments and market conditions. Tailor your strategies accordingly.
NOTES
Historical Data: Ensure ample historical data availability to facilitate precise calculations and avoid inaccuracies stemming from insufficient data points.
Parameter Adjustments: Experiment with adjusting the default periods (27 and 36 bars) if you find them unsuitable for your specific trading style or market conditions.
Visual Customization: Modify the appearance settings, including line styles and gradient colors, to better suit personal preferences without compromising functionality.
Risk Management: While the indicator offers valuable insights, always adhere to robust risk management practices to safeguard against unexpected market fluctuations.
EXAMPLE STRATEGIES
Trend Following: Use the oscillator to confirm existing trends. When Component A crosses above Component B, consider entering long positions; conversely, look for short entries during downward crossovers.
Mean Reversion: Identify extreme readings near the upper (90) or lower (10) bands where prices might revert to mean levels, presenting potential reversal opportunities.
Divergence Analysis: Compare the oscillator's behavior with price action to spot divergences, which often precede trend reversals. Bullish divergence occurs when prices make lower lows but the oscillator shows higher lows, suggesting upward momentum.
Script open-source
Nello spirito di TradingView, l'autore di questo script lo ha reso open source, in modo che i trader possano esaminarne e verificarne la funzionalità. Complimenti all'autore! Sebbene sia possibile utilizzarlo gratuitamente, ricordiamo che la ripubblicazione del codice è soggetta al nostro Regolamento.
Avoid losing contact!Don't miss out! The first and most important thing to do is to join my Discord chat now! Click here to start your adventure: discord.com/invite/ZTGpQJq 防止失联,请立即行动,加入本猫聊天群: discord.com/invite/ZTGpQJq
Declinazione di responsabilità
Le informazioni e le pubblicazioni non sono intese come, e non costituiscono, consulenza o raccomandazioni finanziarie, di investimento, di trading o di altro tipo fornite o approvate da TradingView. Per ulteriori informazioni, consultare i Termini di utilizzo.