PROTECTED SOURCE SCRIPT
Support Resistance By VIPIN(30D • MTF • Safe v4)

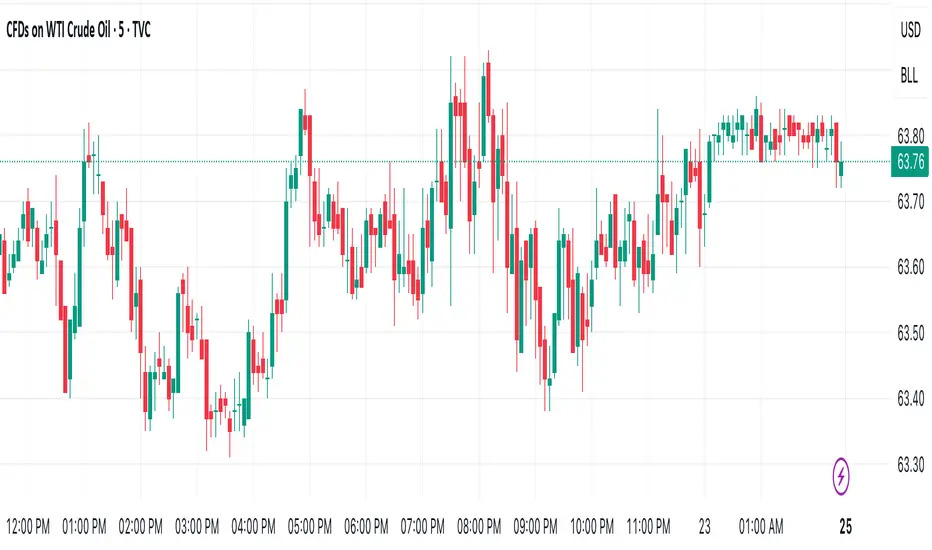
This script automatically detects and plots strong Support & Resistance levels based on pivot highs/lows within a custom lookback period.
Key features:
• Lookback window (days): Select how many past days to scan for pivots.
• Pivot strength: Adjustable left/right bars to filter minor vs. strong swings.
• Clustering: Nearby levels are merged using either ATR-based proximity or percentage proximity.
• Touches count: Each level records how many times it has been tested/retested.
• Ranking: Top N strongest support and resistance levels are highlighted.
• Multi-Timeframe (MTF): Option to detect levels from a higher timeframe while viewing a lower chart.
• Labels: Show price, touch count, and timeframe (optional), with ability to shift labels to the right of current price action.
• Custom styling: Colors, line width, and label placement are fully configurable.
This tool is designed for traders who want to quickly identify key zones of market reaction.
It is not a buy/sell signal generator, but an analytical aid to help you make better decisions alongside your own strategy.
⸻
🔹 How to use
1. Apply on your desired symbol and timeframe.
2. Adjust pivot length and lookback to control sensitivity.
3. Use ATR or % proximity for clustering based on market volatility.
4. Combine levels with your own price action, volume, or strategy confirmation.
This script is created for educational purposes to help traders understand how Support and Resistance zones are formed in the market.
It shows how price reacts to certain levels by:
• Identifying pivots (swing highs and lows).
• Merging nearby levels into zones using ATR or percentage-based proximity.
• Counting how many times a level has been tested or touched.
• Highlighting the most relevant zones with labels.
By studying these zones, traders can learn:
• How markets often respect previously tested levels.
• Why certain levels act as barriers (support or resistance).
• How different timeframes can show different key levels.
⚠️ Note:
This indicator is intended as a learning & analysis tool only. It does not provide buy/sell signals or guarantee results. Always combine it with your own knowledge, analysis, and risk management.
Script protetto
Questo script è pubblicato come codice protetto. Tuttavia, è possibile utilizzarlo liberamente e senza alcuna limitazione – per saperne di più clicca qui.
Declinazione di responsabilità
Le informazioni ed i contenuti pubblicati non costituiscono in alcun modo una sollecitazione ad investire o ad operare nei mercati finanziari. Non sono inoltre fornite o supportate da TradingView. Maggiori dettagli nelle Condizioni d'uso.