OPEN-SOURCE SCRIPT
Resistances v2[UO] - Uncluttered Display
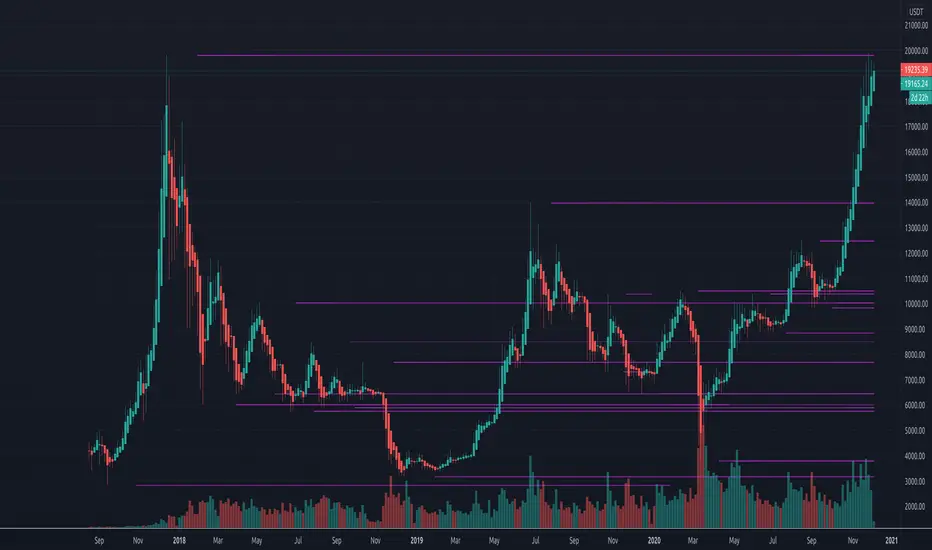
This script shows support-and-resistance levels that span months and weeks.
It also shows the levels in the last 100 bars in higher detail. Details detection is only applied to last 100 bars so that your chart is not cluttered with infinite horizontal lines. 100 can be changed in the settings.
For example, here, you see the levels in small time frames at a different detail level:
This script uses the arrays introduced in pine script v4
Script open-source
Nello spirito di TradingView, l'autore di questo script lo ha reso open source, in modo che i trader possano esaminarne e verificarne la funzionalità. Complimenti all'autore! Sebbene sia possibile utilizzarlo gratuitamente, ricordiamo che la ripubblicazione del codice è soggetta al nostro Regolamento.
Declinazione di responsabilità
Le informazioni e le pubblicazioni non sono intese come, e non costituiscono, consulenza o raccomandazioni finanziarie, di investimento, di trading o di altro tipo fornite o approvate da TradingView. Per ulteriori informazioni, consultare i Termini di utilizzo.