OPEN-SOURCE SCRIPT
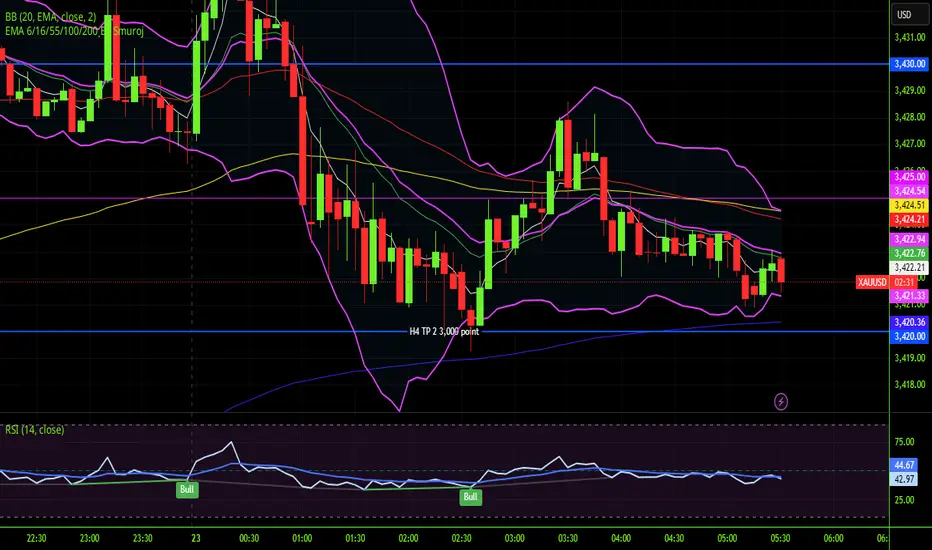
EMA 6/16/55/100/200 ฺBy Smuroj
คำอธิบายเป็นภาษาไทย
ชุด EMA นี้ประกอบด้วยเส้นค่าเฉลี่ยเคลื่อนที่แบบเอ็กซ์โปเนนเชียล (EMA) ระยะเวลาต่าง ๆ ซึ่งถูกนำมาใช้เพื่อวิเคราะห์แนวโน้มราคาในระยะต่าง ๆ ดังนี้:
EMA 6 และ 16: ใช้สำหรับดูแนวโน้มระยะสั้นและการเปลี่ยนแปลงราคาที่รวดเร็ว
EMA 55: เป็นแนวโน้มระยะกลาง
EMA 100 และ 200: เป็นแนวโน้มระยะยาว ซึ่งช่วยดูภาพรวมของแนวโน้มตลาดในระดับลึก
การใช้งานในการเทรด:
ถ้าราคาอยู่เหนือ EMA ระยะต่าง ๆ แสดงถึงแนวโน้มขาขึ้น
ถ้าราคาอยู่ต่ำกว่า EMA ระยะต่าง ๆ แสดงถึงแนวโน้มขาลง
การตัดกันของ EMA สั้นและยาว เช่น EMA 6 ตัด EMA 16 ขึ้นบน อาจเป็นสัญญาณซื้อ
การตัดกันในทางตรงกันข้าม อาจเป็นสัญญาณขาย
การใช้หลายเส้นช่วยยืนยันแนวโน้มและลดความผิดพลาดในการตัดสินใจ
English Explanation
This EMA set consists of various Exponential Moving Average lines over different periods, which are used to analyze price trends across various timeframes:
EMA 6 and 16: For short-term trend analysis and quick price changes.
EMA 55: Represents a medium-term trend.
EMA 100 and 200: Indicate long-term trends, helping to view the overall market direction.
How to use in trading:
When price is above these EMA lines, it suggests an uptrend.
When price is below these EMA lines, it indicates a downtrend.
Crossovers between short and longer EMAs (e.g., EMA 6 crossing above EMA 16) can signal buy opportunities.
Conversely, crossovers downward can signal sell opportunities.
Using multiple EMA lines helps confirm the trend and reduce false signals.
Script open-source
In pieno spirito TradingView, il creatore di questo script lo ha reso open-source, in modo che i trader possano esaminarlo e verificarne la funzionalità. Complimenti all'autore! Sebbene sia possibile utilizzarlo gratuitamente, ricorda che la ripubblicazione del codice è soggetta al nostro Regolamento.
Declinazione di responsabilità
Le informazioni ed i contenuti pubblicati non costituiscono in alcun modo una sollecitazione ad investire o ad operare nei mercati finanziari. Non sono inoltre fornite o supportate da TradingView. Maggiori dettagli nelle Condizioni d'uso.