OPEN-SOURCE SCRIPT
Aggiornato Comparison Candles
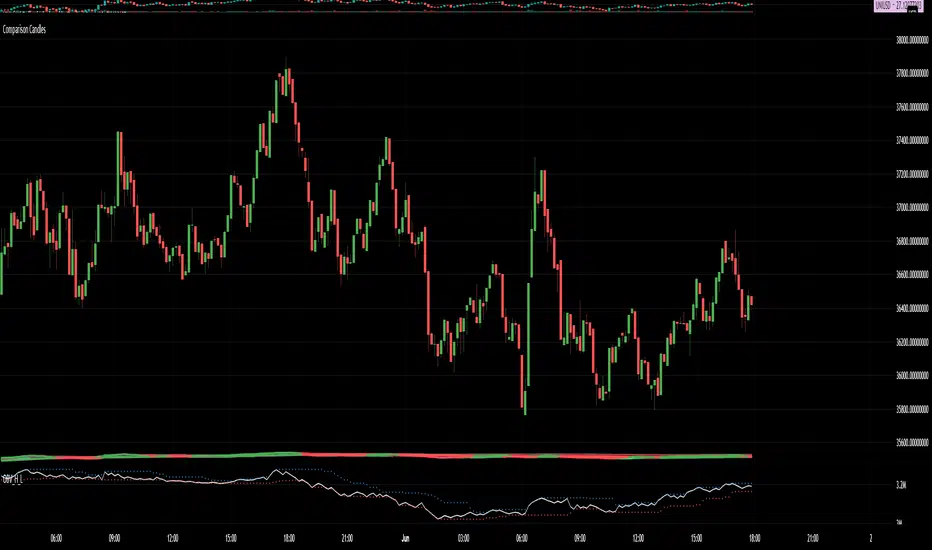
Pretty simple. Pick a security and it plots candlesticks to compare it to the current chart.
So if looking at CAKEBTC and comparing to UNIBTC, you get CAKEUNI.
Beats the hell out of plotting multiple plots and trying to compare them. No longer is your scale based on where your zoom starts.
Also allows you to draw oscillators from the plots.
Shown is my Uber RSI plotted on the comparison candles close on CAKEUNI (binance both).
No longer struggle to chart against messed up uniswap charts because your exchange of choice isn't listed on tradingview.
No longer struggle to chart ethereum pairs that don't exist on any of the exchanges supported officially by Tradingview charting.
"You just win."
Note di rilascio
Added more plots to draw indicators from. They are "display on" but transparent.Includes the common HL2, HLC3, OHLC4, but also OC2 and weighted HLC3s for extra measure.
Note di rilascio
Fixed the color plot... was based on the original chart instead of the comparison. Woops!Script open-source
In pieno spirito TradingView, il creatore di questo script lo ha reso open-source, in modo che i trader possano esaminarlo e verificarne la funzionalità. Complimenti all'autore! Sebbene sia possibile utilizzarlo gratuitamente, ricorda che la ripubblicazione del codice è soggetta al nostro Regolamento.
Declinazione di responsabilità
Le informazioni ed i contenuti pubblicati non costituiscono in alcun modo una sollecitazione ad investire o ad operare nei mercati finanziari. Non sono inoltre fornite o supportate da TradingView. Maggiori dettagli nelle Condizioni d'uso.
Script open-source
In pieno spirito TradingView, il creatore di questo script lo ha reso open-source, in modo che i trader possano esaminarlo e verificarne la funzionalità. Complimenti all'autore! Sebbene sia possibile utilizzarlo gratuitamente, ricorda che la ripubblicazione del codice è soggetta al nostro Regolamento.
Declinazione di responsabilità
Le informazioni ed i contenuti pubblicati non costituiscono in alcun modo una sollecitazione ad investire o ad operare nei mercati finanziari. Non sono inoltre fornite o supportate da TradingView. Maggiori dettagli nelle Condizioni d'uso.