OPEN-SOURCE SCRIPT
Livelli (levels)
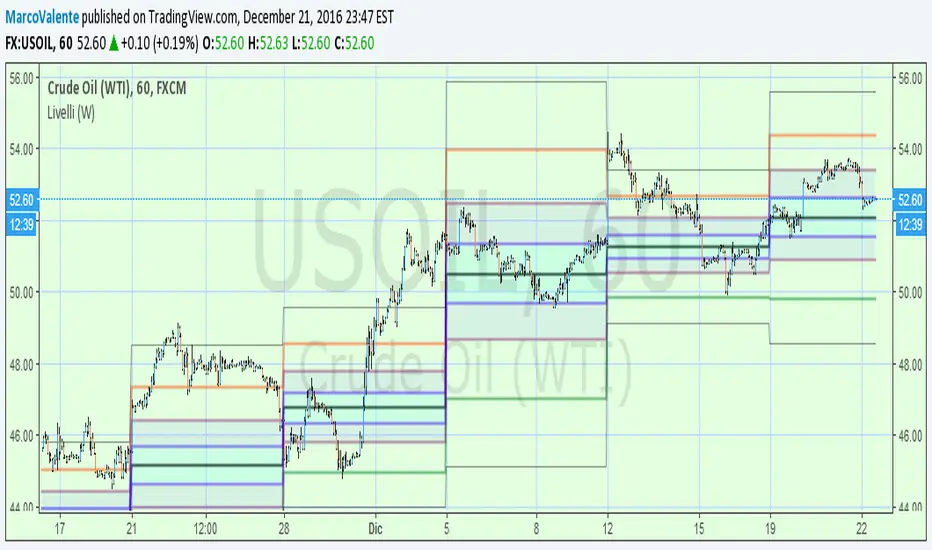
This script use the pivot point (S1 and R1) and then apply the Fibo to the range of S1 , R1. With this level can see and find easly the next support and resistance. From the format can customize the period of Pivot , and the pivotperiod should be greater then the chart period.
Script open-source
In pieno spirito TradingView, il creatore di questo script lo ha reso open-source, in modo che i trader possano esaminarlo e verificarne la funzionalità. Complimenti all'autore! Sebbene sia possibile utilizzarlo gratuitamente, ricorda che la ripubblicazione del codice è soggetta al nostro Regolamento.
Declinazione di responsabilità
Le informazioni ed i contenuti pubblicati non costituiscono in alcun modo una sollecitazione ad investire o ad operare nei mercati finanziari. Non sono inoltre fornite o supportate da TradingView. Maggiori dettagli nelle Condizioni d'uso.