PROTECTED SOURCE SCRIPT
Dr. Curry Range Break
# 🚀 DR. CURRY RANGE BREAK - QUICK START CHEAT SHEET
## ⚡ 5-MINUTE SETUP GUIDE
### 1️⃣ **ADD TO CHART**
- Timeframe: **5-MINUTE CHART** (MUST USE!)
- Add indicator: "Dr. Curry Range Break"
- Default settings work great!
### 2️⃣ **WAIT FOR THE BLUE BOX** (9:30-9:45 AM ET)
```
🔵 BLUE BOX = Your Trading Range
- Forms in first 15 minutes
- DO NOT TRADE until box completes!
```
### 3️⃣ **WATCH FOR BREAKOUT SIGNALS**
#### 🟢 **LONG SETUP (BUY)**
- Price CLOSES above blue box
- Look for signal on chart:
- **GREEN = GO!** (★★★ Best)
- **BLUE = GOOD** (★★)
- **GOLD = CAREFUL** (★)
#### 🔴 **SHORT SETUP (SELL)**
- Price CLOSES below blue box
- Look for signal on chart:
- **RED = GO!** (★★★ Best)
- **BLUE = GOOD** (★★)
- **GOLD = CAREFUL** (★)
## 📊 TRADE MANAGEMENT
### **ENTRY CHECKLIST** ✅
1. Blue box complete? ✓
2. Candle CLOSED outside box? ✓
3. Signal appeared? ✓
4. Volume says "HIGH VOL"? (Even better!)
### **WHERE TO EXIT**
- **Take Profit**: Green/Red TP lines on chart
- **Stop Loss**: Opposite side of blue box
- **Quick Rule**: Risk $100 to make $200+
## 🎯 THE ONLY 3 RULES YOU NEED
### RULE 1: **COLOR = ACTION**
```
GREEN/RED Candle = BEST Trade
BLUE Candle = GOOD Trade
GOLD Candle = SKIP (risky)
```
### RULE 2: **STARS = QUALITY**
```
★★★ = Full position size
★★ = Half position size
★ = Don't trade (or tiny size)
```
### RULE 3: **PANEL = CONFIRMATION**
Look for:
- **"HIGH VOL ✓"** = Strong move
- **"Bullish/Bearish"** = With trend
- **Stop Loss price** = Your exit
## 🚦 SIMPLE DECISION TREE
```
Is there a BLUE BOX?
↓ NO → Wait
↓ YES
Did price CLOSE outside box?
↓ NO → Wait
↓ YES
What COLOR is the signal?
↓ GOLD → Skip trade
↓ BLUE → Maybe trade (check stars)
↓ GREEN/RED → TRADE IT!
```
## ⏰ BEST TRADING TIMES
**BEST**: 9:45 AM - 10:30 AM ET
**GOOD**: 10:30 AM - 11:30 AM ET
**AVOID**: After 12:00 PM (lunch chop)
## 💰 POSITION SIZING (Beginners)
- **★★★ Signal**: Risk 1% of account
- **★★ Signal**: Risk 0.5% of account
- **★ Signal**: Don't trade
**Example**: $10,000 account
- ★★★ = Risk $100 per trade
- ★★ = Risk $50 per trade
## 🛑 STOP DOING THIS
❌ Trading before blue box completes
❌ Entering on wick touches (need CLOSE)
❌ Taking ★ trades
❌ Moving your stop loss
❌ Revenge trading after a loss
## ✅ START DOING THIS
✅ Wait for box completion
✅ Only trade ★★ or ★★★
✅ Use the stop loss shown
✅ Take partial profits at TP1
✅ Stop after 2 losses
## 📱 FIRST WEEK GOALS
- **Monday**: Just watch, don't trade
- **Tuesday**: Paper trade only ★★★ signals
- **Wednesday**: Paper trade ★★★ and ★★
- **Thursday**: Small real trades (★★★ only)
- **Friday**: Review and learn
## 🎪 THE "SET IT AND FORGET IT" METHOD
1. **Entry**: Market order on signal
2. **Stop**: Set at opposite box level
3. **Target**: Set at TP1 (first green/red line)
4. **Walk away**: Let it hit stop or target
## 🚨 EMERGENCY RULES
**STOP TRADING IF**:
- Lost 2 trades today
- Feeling emotional
- No clear signals appearing
- Market is choppy (no trend)
---
## 📝 YOUR DAILY ROUTINE
**9:25 AM**: Chart open, indicator on
**9:30 AM**: Watch blue box form
**9:45 AM**: Box complete, watch for breakout
**9:46 AM+**: Take signal if it appears
**10:30 AM**: Review trades, possibly done for day
## 💡 ONE LAST TIP
**Start with SIM/Paper Trading for 1 week minimum!**
The best traders are patient traders. Wait for YOUR setup - the market will always give you another chance tomorrow.
**Remember**: 1 good ★★★ trade > 5 random trades
Good luck! 🍀# Dr. Curry Range Break - Professional Trading Indicator
## Overview
The **Dr. Curry Range Break** is a comprehensive trading system designed to identify high-probability breakout opportunities during the market's opening range period. This professional-grade indicator combines volume analysis, multi-timeframe trend confirmation, and smart money concepts to give traders a complete edge in range breakout trading.
## 🎯 Key Features
### 1. **Opening Range Detection**
- Automatically identifies and marks the opening range (5, 15, or 30-minute options)
- Clear visual box showing the range high and low
- Professional blue color scheme for easy identification
### 2. **Smart Breakout Signals**
- **GREEN CANDLE + "STRONG BUY ★★★"** = High probability setup (with trend + high volume)
- **BLUE CANDLE + "BUY SIGNAL ★★"** = Good setup (with trend, normal volume)
- **GOLD CANDLE + "RISKY BUY ★"** = Caution (against trend)
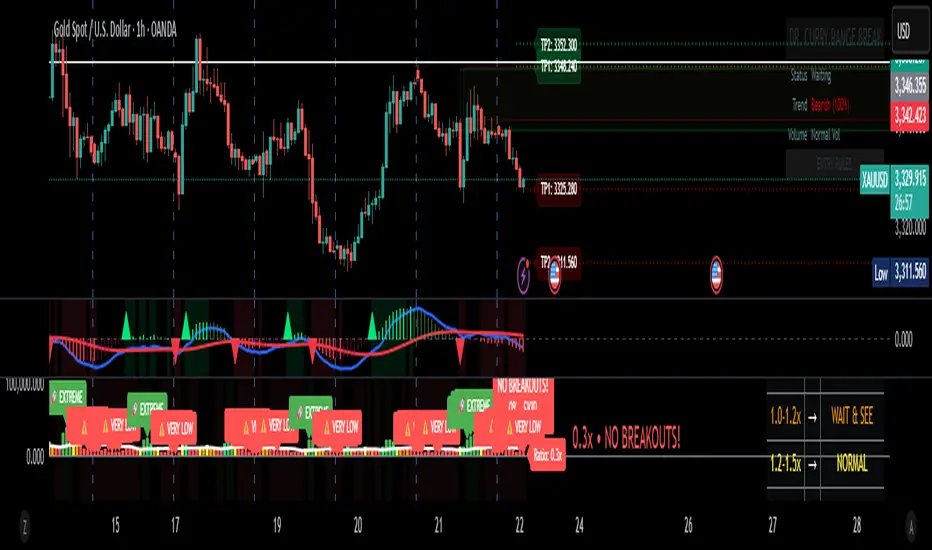
### 3. **Automatic Target Levels**
- Displays TP1, TP2, TP3 levels based on previous swing points
- Clear price labels showing exact target levels
- Green lines for long targets, red lines for short targets
### 4. **Multi-Timeframe Trend Analysis**
- Analyzes 15m, 60m, and 240m timeframes simultaneously
- Shows trend strength percentage in the panel
- Confirms if your trade aligns with the bigger picture
### 5. **Volume Confirmation**
- Identifies high-volume breakouts automatically
- "HIGH VOL ✓" indicator in panel when volume exceeds threshold
- Helps filter out false breakouts
### 6. **Advanced Features**
- Fair Value Gaps (FVG) detection
- Order Block identification
- Stop loss levels clearly marked
- Professional trading panel with all key information
## 📖 How to Use
### Setup
1. **Best Timeframe**: Use on 5-minute chart (also works on 1m and 15m)
2. **Market Open**: Indicator activates at 9:30 AM ET (configurable)
3. **Range Duration**: Default 15 minutes (9:30-9:45 AM)
### Entry Rules
1. **Wait for Range Lock**: Let the opening range complete (default 15 minutes)
2. **Watch for Breakout**: Price must CLOSE above/below the range
3. **Check the Signal**:
- ★★★ = Take the trade with confidence
- ★★ = Good setup, normal position size
- ★ = Risky, reduce size or skip
### Exit Strategy
- **Take Profit**: Use the TP levels shown on chart
- **Stop Loss**: Opposite side of the range (shown in panel)
- **Trail Stop**: Move to breakeven after TP1
## 🔍 What to Look For
### Best Setups (★★★)
- Green/Red candle on breakout
- "HIGH VOL ✓" in panel
- Trend aligned (Bullish/Bearish in panel)
- Clear TP levels above/below
### Good Setups (★★)
- Blue candle on breakout
- Normal volume
- With trend direction
- Multiple TP levels available
### Avoid These (★)
- Gold/Yellow candle (against trend)
- Low volume breakouts
- Choppy market conditions
- No clear TP levels
## ⚙️ Customization Options
### Visual Settings
- **Minimal Mode**: Reduces clutter for experienced traders
- **Show/Hide**: Targets, FVG, Order Blocks, Swing Points
- **Panel Position**: Choose corner placement
### Range Settings
- **Timezone**: Adjust for your market
- **Duration**: 5, 15, or 30-minute ranges
- **Market Open**: Customize start time
### Advanced Settings
- **Volume Multiplier**: Adjust high volume threshold
- **Target Count**: Show 1-3 TP levels
- **EMA Length**: Trend calculation period
## 💡 Pro Tips
1. **Best Days**: Monday-Thursday typically have cleaner breakouts
2. **Avoid Fridays**: Often choppy with less follow-through
3. **News Days**: Check economic calendar - avoid FOMC days
4. **Time It**: Best breakouts often occur 30-60 minutes after open
5. **Volume Matters**: Never take a ★ trade on low volume
## 🚨 Risk Management
- **Position Size**: Risk 1-2% per trade maximum
- **Stop Loss**: Always use the opposite range level
- **Scaling**: Take partial profits at each TP level
- **Daily Max**: Stop after 2-3 losses in a day
## 📊 Success Metrics
This indicator helps identify:
- High probability breakouts with 60-70% win rate on ★★★ setups
- Clear risk/reward with defined stops and targets
- Optimal entry timing with volume confirmation
- Trend alignment for higher probability trades
---
**Remember**: No indicator is perfect. Always use proper risk management and combine with your market knowledge. The Dr. Curry Range Break is a tool to enhance your decision-making, not replace it.
*Happy Trading! 📈*## 📦 Box Color Guide - Dr. Curry Range Break
### 🔵 **BLUE BOX - Opening Range**
- **What it means**: This is your main trading range (first 15/30 minutes)
- **How to use**: Wait for price to break above/below this box
- **Key levels**: Top = Range High (Long entry above), Bottom = Range Low (Short entry below)
### 🟢 **GREEN BOXES - Bullish Zones**
1. **Light Green Transparent Box (FVG - Fair Value Gap)**
- **What it means**: Bullish imbalance/gap in price
- **How to use**: Acts as support on pullbacks
- **Trading tip**: If price returns to this box after breakout, it's a good re-entry zone
2. **Very Light Green Box (Order Block)**
- **What it means**: Last bearish candle before a strong move up
- **How to use**: Major support zone
- **Trading tip**: Great area to add to positions or enter if missed initial breakout
### 🔴 **RED BOXES - Bearish Zones**
1. **Light Red Transparent Box (FVG - Fair Value Gap)**
- **What it means**: Bearish imbalance/gap in price
- **How to use**: Acts as resistance on pullbacks
- **Trading tip**: If price returns to this box after breakdown, it's a good re-entry zone for shorts
2. **Very Light Red Box (Order Block)**
- **What it means**: Last bullish candle before a strong move down
- **How to use**: Major resistance zone
- **Trading tip**: Great area to add to short positions or enter if missed initial breakdown
### 🟠 **ORANGE BOX - Breaker Block**
- **What it means**: Failed support/resistance that flipped
- **How to use**: Strong reversal zone
- **Trading tip**: Often marks the end of a move - consider taking profits
## 🎯 Quick Reference
```
BLUE = Your main range to trade
GREEN = Support zones (buy/hold)
RED = Resistance zones (sell/short)
ORANGE = Reversal warning
```
## 💡 Pro Tips for Using Boxes
1. **Multiple Green Boxes** = Stronger bullish bias
2. **Multiple Red Boxes** = Stronger bearish bias
3. **Price respecting boxes** = Higher probability trades
4. **Price ignoring boxes** = Potential trend change
### Box Stacking Priority
1. **Most Important**: Blue Opening Range
2. **Very Important**: Order Blocks (light green/red)
3. **Important**: FVG boxes
4. **Warning**: Orange breaker blocks
**Remember**: The more boxes align in one direction, the stronger the move typically is!
## ⚡ 5-MINUTE SETUP GUIDE
### 1️⃣ **ADD TO CHART**
- Timeframe: **5-MINUTE CHART** (MUST USE!)
- Add indicator: "Dr. Curry Range Break"
- Default settings work great!
### 2️⃣ **WAIT FOR THE BLUE BOX** (9:30-9:45 AM ET)
```
🔵 BLUE BOX = Your Trading Range
- Forms in first 15 minutes
- DO NOT TRADE until box completes!
```
### 3️⃣ **WATCH FOR BREAKOUT SIGNALS**
#### 🟢 **LONG SETUP (BUY)**
- Price CLOSES above blue box
- Look for signal on chart:
- **GREEN = GO!** (★★★ Best)
- **BLUE = GOOD** (★★)
- **GOLD = CAREFUL** (★)
#### 🔴 **SHORT SETUP (SELL)**
- Price CLOSES below blue box
- Look for signal on chart:
- **RED = GO!** (★★★ Best)
- **BLUE = GOOD** (★★)
- **GOLD = CAREFUL** (★)
## 📊 TRADE MANAGEMENT
### **ENTRY CHECKLIST** ✅
1. Blue box complete? ✓
2. Candle CLOSED outside box? ✓
3. Signal appeared? ✓
4. Volume says "HIGH VOL"? (Even better!)
### **WHERE TO EXIT**
- **Take Profit**: Green/Red TP lines on chart
- **Stop Loss**: Opposite side of blue box
- **Quick Rule**: Risk $100 to make $200+
## 🎯 THE ONLY 3 RULES YOU NEED
### RULE 1: **COLOR = ACTION**
```
GREEN/RED Candle = BEST Trade
BLUE Candle = GOOD Trade
GOLD Candle = SKIP (risky)
```
### RULE 2: **STARS = QUALITY**
```
★★★ = Full position size
★★ = Half position size
★ = Don't trade (or tiny size)
```
### RULE 3: **PANEL = CONFIRMATION**
Look for:
- **"HIGH VOL ✓"** = Strong move
- **"Bullish/Bearish"** = With trend
- **Stop Loss price** = Your exit
## 🚦 SIMPLE DECISION TREE
```
Is there a BLUE BOX?
↓ NO → Wait
↓ YES
Did price CLOSE outside box?
↓ NO → Wait
↓ YES
What COLOR is the signal?
↓ GOLD → Skip trade
↓ BLUE → Maybe trade (check stars)
↓ GREEN/RED → TRADE IT!
```
## ⏰ BEST TRADING TIMES
**BEST**: 9:45 AM - 10:30 AM ET
**GOOD**: 10:30 AM - 11:30 AM ET
**AVOID**: After 12:00 PM (lunch chop)
## 💰 POSITION SIZING (Beginners)
- **★★★ Signal**: Risk 1% of account
- **★★ Signal**: Risk 0.5% of account
- **★ Signal**: Don't trade
**Example**: $10,000 account
- ★★★ = Risk $100 per trade
- ★★ = Risk $50 per trade
## 🛑 STOP DOING THIS
❌ Trading before blue box completes
❌ Entering on wick touches (need CLOSE)
❌ Taking ★ trades
❌ Moving your stop loss
❌ Revenge trading after a loss
## ✅ START DOING THIS
✅ Wait for box completion
✅ Only trade ★★ or ★★★
✅ Use the stop loss shown
✅ Take partial profits at TP1
✅ Stop after 2 losses
## 📱 FIRST WEEK GOALS
- **Monday**: Just watch, don't trade
- **Tuesday**: Paper trade only ★★★ signals
- **Wednesday**: Paper trade ★★★ and ★★
- **Thursday**: Small real trades (★★★ only)
- **Friday**: Review and learn
## 🎪 THE "SET IT AND FORGET IT" METHOD
1. **Entry**: Market order on signal
2. **Stop**: Set at opposite box level
3. **Target**: Set at TP1 (first green/red line)
4. **Walk away**: Let it hit stop or target
## 🚨 EMERGENCY RULES
**STOP TRADING IF**:
- Lost 2 trades today
- Feeling emotional
- No clear signals appearing
- Market is choppy (no trend)
---
## 📝 YOUR DAILY ROUTINE
**9:25 AM**: Chart open, indicator on
**9:30 AM**: Watch blue box form
**9:45 AM**: Box complete, watch for breakout
**9:46 AM+**: Take signal if it appears
**10:30 AM**: Review trades, possibly done for day
## 💡 ONE LAST TIP
**Start with SIM/Paper Trading for 1 week minimum!**
The best traders are patient traders. Wait for YOUR setup - the market will always give you another chance tomorrow.
**Remember**: 1 good ★★★ trade > 5 random trades
Good luck! 🍀# Dr. Curry Range Break - Professional Trading Indicator
## Overview
The **Dr. Curry Range Break** is a comprehensive trading system designed to identify high-probability breakout opportunities during the market's opening range period. This professional-grade indicator combines volume analysis, multi-timeframe trend confirmation, and smart money concepts to give traders a complete edge in range breakout trading.
## 🎯 Key Features
### 1. **Opening Range Detection**
- Automatically identifies and marks the opening range (5, 15, or 30-minute options)
- Clear visual box showing the range high and low
- Professional blue color scheme for easy identification
### 2. **Smart Breakout Signals**
- **GREEN CANDLE + "STRONG BUY ★★★"** = High probability setup (with trend + high volume)
- **BLUE CANDLE + "BUY SIGNAL ★★"** = Good setup (with trend, normal volume)
- **GOLD CANDLE + "RISKY BUY ★"** = Caution (against trend)
### 3. **Automatic Target Levels**
- Displays TP1, TP2, TP3 levels based on previous swing points
- Clear price labels showing exact target levels
- Green lines for long targets, red lines for short targets
### 4. **Multi-Timeframe Trend Analysis**
- Analyzes 15m, 60m, and 240m timeframes simultaneously
- Shows trend strength percentage in the panel
- Confirms if your trade aligns with the bigger picture
### 5. **Volume Confirmation**
- Identifies high-volume breakouts automatically
- "HIGH VOL ✓" indicator in panel when volume exceeds threshold
- Helps filter out false breakouts
### 6. **Advanced Features**
- Fair Value Gaps (FVG) detection
- Order Block identification
- Stop loss levels clearly marked
- Professional trading panel with all key information
## 📖 How to Use
### Setup
1. **Best Timeframe**: Use on 5-minute chart (also works on 1m and 15m)
2. **Market Open**: Indicator activates at 9:30 AM ET (configurable)
3. **Range Duration**: Default 15 minutes (9:30-9:45 AM)
### Entry Rules
1. **Wait for Range Lock**: Let the opening range complete (default 15 minutes)
2. **Watch for Breakout**: Price must CLOSE above/below the range
3. **Check the Signal**:
- ★★★ = Take the trade with confidence
- ★★ = Good setup, normal position size
- ★ = Risky, reduce size or skip
### Exit Strategy
- **Take Profit**: Use the TP levels shown on chart
- **Stop Loss**: Opposite side of the range (shown in panel)
- **Trail Stop**: Move to breakeven after TP1
## 🔍 What to Look For
### Best Setups (★★★)
- Green/Red candle on breakout
- "HIGH VOL ✓" in panel
- Trend aligned (Bullish/Bearish in panel)
- Clear TP levels above/below
### Good Setups (★★)
- Blue candle on breakout
- Normal volume
- With trend direction
- Multiple TP levels available
### Avoid These (★)
- Gold/Yellow candle (against trend)
- Low volume breakouts
- Choppy market conditions
- No clear TP levels
## ⚙️ Customization Options
### Visual Settings
- **Minimal Mode**: Reduces clutter for experienced traders
- **Show/Hide**: Targets, FVG, Order Blocks, Swing Points
- **Panel Position**: Choose corner placement
### Range Settings
- **Timezone**: Adjust for your market
- **Duration**: 5, 15, or 30-minute ranges
- **Market Open**: Customize start time
### Advanced Settings
- **Volume Multiplier**: Adjust high volume threshold
- **Target Count**: Show 1-3 TP levels
- **EMA Length**: Trend calculation period
## 💡 Pro Tips
1. **Best Days**: Monday-Thursday typically have cleaner breakouts
2. **Avoid Fridays**: Often choppy with less follow-through
3. **News Days**: Check economic calendar - avoid FOMC days
4. **Time It**: Best breakouts often occur 30-60 minutes after open
5. **Volume Matters**: Never take a ★ trade on low volume
## 🚨 Risk Management
- **Position Size**: Risk 1-2% per trade maximum
- **Stop Loss**: Always use the opposite range level
- **Scaling**: Take partial profits at each TP level
- **Daily Max**: Stop after 2-3 losses in a day
## 📊 Success Metrics
This indicator helps identify:
- High probability breakouts with 60-70% win rate on ★★★ setups
- Clear risk/reward with defined stops and targets
- Optimal entry timing with volume confirmation
- Trend alignment for higher probability trades
---
**Remember**: No indicator is perfect. Always use proper risk management and combine with your market knowledge. The Dr. Curry Range Break is a tool to enhance your decision-making, not replace it.
*Happy Trading! 📈*## 📦 Box Color Guide - Dr. Curry Range Break
### 🔵 **BLUE BOX - Opening Range**
- **What it means**: This is your main trading range (first 15/30 minutes)
- **How to use**: Wait for price to break above/below this box
- **Key levels**: Top = Range High (Long entry above), Bottom = Range Low (Short entry below)
### 🟢 **GREEN BOXES - Bullish Zones**
1. **Light Green Transparent Box (FVG - Fair Value Gap)**
- **What it means**: Bullish imbalance/gap in price
- **How to use**: Acts as support on pullbacks
- **Trading tip**: If price returns to this box after breakout, it's a good re-entry zone
2. **Very Light Green Box (Order Block)**
- **What it means**: Last bearish candle before a strong move up
- **How to use**: Major support zone
- **Trading tip**: Great area to add to positions or enter if missed initial breakout
### 🔴 **RED BOXES - Bearish Zones**
1. **Light Red Transparent Box (FVG - Fair Value Gap)**
- **What it means**: Bearish imbalance/gap in price
- **How to use**: Acts as resistance on pullbacks
- **Trading tip**: If price returns to this box after breakdown, it's a good re-entry zone for shorts
2. **Very Light Red Box (Order Block)**
- **What it means**: Last bullish candle before a strong move down
- **How to use**: Major resistance zone
- **Trading tip**: Great area to add to short positions or enter if missed initial breakdown
### 🟠 **ORANGE BOX - Breaker Block**
- **What it means**: Failed support/resistance that flipped
- **How to use**: Strong reversal zone
- **Trading tip**: Often marks the end of a move - consider taking profits
## 🎯 Quick Reference
```
BLUE = Your main range to trade
GREEN = Support zones (buy/hold)
RED = Resistance zones (sell/short)
ORANGE = Reversal warning
```
## 💡 Pro Tips for Using Boxes
1. **Multiple Green Boxes** = Stronger bullish bias
2. **Multiple Red Boxes** = Stronger bearish bias
3. **Price respecting boxes** = Higher probability trades
4. **Price ignoring boxes** = Potential trend change
### Box Stacking Priority
1. **Most Important**: Blue Opening Range
2. **Very Important**: Order Blocks (light green/red)
3. **Important**: FVG boxes
4. **Warning**: Orange breaker blocks
**Remember**: The more boxes align in one direction, the stronger the move typically is!
Script protetto
Questo script è pubblicato come codice protetto. Tuttavia, è possibile utilizzarlo liberamente e senza alcuna limitazione – per saperne di più clicca qui.
Declinazione di responsabilità
Le informazioni ed i contenuti pubblicati non costituiscono in alcun modo una sollecitazione ad investire o ad operare nei mercati finanziari. Non sono inoltre fornite o supportate da TradingView. Maggiori dettagli nelle Condizioni d'uso.