PROTECTED SOURCE SCRIPT
Alpha Tracker -> PROFABIGHI_CAPITAL
🌟 Overview
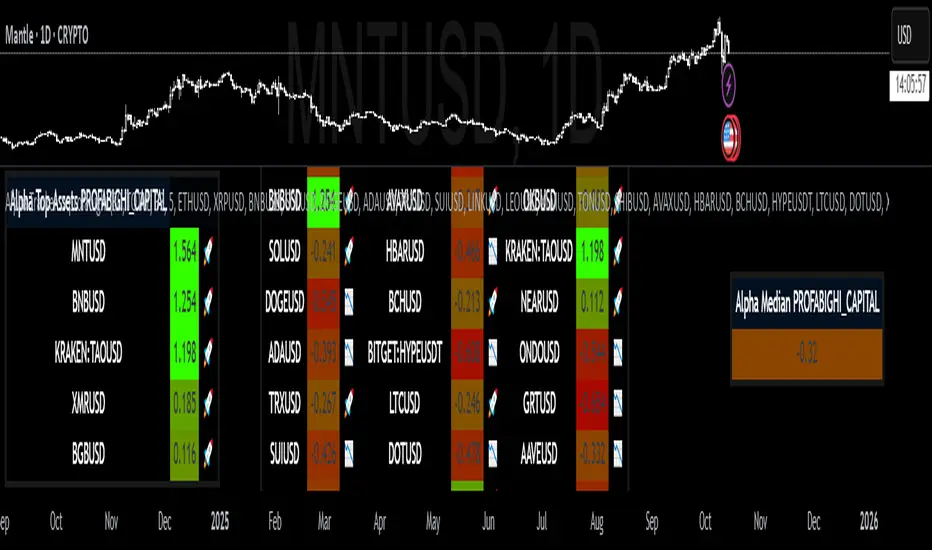
The Alpha Tracker → PROFABIGHI_CAPITAL is a sophisticated performance analytics tool that computes and visualizes the risk-adjusted excess returns (alpha) of up to 33 customizable altcoins against a user-defined benchmark over a flexible lookback horizon. By leveraging daily return covariance and beta adjustments, it dynamically generates color-gradient tables showcasing individual alphas, median benchmarks, and ranked top performers with intuitive emoji indicators, empowering traders to swiftly pinpoint relative outperformance and inform portfolio rotations or allocation decisions.
⚙️ General Settings
– Alpha Measurement Length: Defines the historical window for return averaging and covariance calculations, where shorter periods emphasize recent momentum while longer horizons capture sustained trends—crucial for aligning with trading horizons like short-term scalping (e.g., 10-20 days) versus long-term positioning (e.g., 50+ days).
– Benchmark Symbol: Serves as the market reference for alpha isolation, typically a broad index like total crypto cap to gauge systemic risk-adjusted gains; selecting alternatives like Bitcoin enables coin-specific outperformance analysis.
– Number of Altcoins to Display: Controls the scale of the main table, from a focused watchlist of 5-10 high-conviction assets to a comprehensive 33-symbol scan for broad-market screening—impacts computational load and visual density.
– Number of Top Alpha Assets: Limits the dedicated leaderboard to the highest alphas, streamlining focus on actionable leaders (e.g., 3-7 for quick scans) while maintaining full data in the primary view for deeper dives.
💎 Asset Selection Settings
– Asset 1-17 (Left Group): Curates the primary column of the main table with foundational altcoins, allowing sequential customization from blue-chip like ETHUSD to mid-caps like XRPUSD—each input fetches daily closes for independent alpha computation, with tooltips guiding symbol formatting.
– Asset 18-33 (Right Group): Expands to secondary symbols in the right column, supporting diverse exposure from established tokens like LTCUSD to emerging ones like ONDOUSD—seamless integration ensures balanced left-right distribution for ergonomic table reading.
– Dynamic Input Scaling: Automatically accommodates the total asset count by disabling unused inputs, preventing errors and optimizing data fetches—enables modular expansion from a minimal 5-asset portfolio to full 33 for exhaustive coverage.
🎨 Table Style Settings
– Low Alpha Color: Establishes the gradient's underperformance endpoint (e.g., deep red for negative alphas), visually signaling laggards that may warrant reduction or avoidance in allocations.
– High Alpha Color: Sets the outperformer anchor (e.g., bright green for positive alphas), highlighting assets generating excess returns beyond benchmark expectations.
– Neutral Alpha Value: Anchors the color spectrum's midpoint, where zero or breakeven alphas transition from red to green—fine-tuning shifts the bias toward aggressive or conservative interpretations.
– Alpha Color Range: Widens or narrows the transition bandwidth around neutral, creating smoother blends for subtle rankings or sharper contrasts for binary hot/cold asset identification.
– Table Background: Applies a semi-opaque dark base across all tables, ensuring low-glare readability on both light and dark themes while maintaining professional aesthetics.
– Table Border: Defines frame outlines for structural definition, with gray subtlety preventing visual clutter while framing content effectively.
📡 Data Fetching
– Benchmark Data Retrieval: Employs security requests for daily closes from the chosen symbol, ensuring a stable time series for covariance baseline without intraday noise.
– Asset Data Retrieval: Parallel daily close fetches for selected symbols, gracefully handling invalid inputs by substituting NA values to preserve table stability.
– Rate of Change Computation: Derives 1-period percentage returns for assets and benchmark, forming the raw input for mean and covariance matrices.
– Error Handling for NA Values: Replaces missing data with sentinel placeholders (-9999) in tables, displaying as gray neutrals to flag data gaps without disrupting layout.
🧮 Calculations
– Return Series Generation: Applies rate of change over one day for each asset and benchmark, capturing discrete daily movements essential for alpha's excess return focus.
– Mean Return Averaging: Computes simple moving averages of returns over the lookback, providing smoothed historical performance baselines for both series.
– Covariance Estimation: Averages the product of asset and benchmark returns minus their means' product, quantifying linear co-dependence critical for beta adjustment.
– Benchmark Variance: Averages squared benchmark deviations from its mean, measuring systemic volatility to normalize asset sensitivity.
– Beta Coefficient: Divides covariance by variance to derive market beta, isolating systematic risk before alpha extraction.
– Alpha Derivation: Subtracts beta-adjusted benchmark mean from asset mean, yielding the intercept as true excess return attributable to security-specific factors.
📋 Table Display
– Dynamic Table Dimensions: Auto-scales columns (up to 9 for tri-column layout) and rows based on asset count plus header, optimizing space for 1-33 symbols without overflow.
– Main Table Population: Features a branded header spanning the top, followed by asset symbols, rounded alphas (3 decimals), and performance emojis in balanced trios for scannable rows.
– Alpha Color Gradient: Maps values from low (red) through neutral (midpoint) to high (green), with gray for invalids—enables instant visual ranking across the dataset.
– Emoji Performance Icons: Renders rocket for above-median alphas (outperformers) and downward arrow for below (laggards), adding emotional quick-scan appeal.
– Median Table Summary: Compact single-column view of the central alpha with gradient coloring, serving as a neutral benchmark for relative assessments.
– Top Assets Table: Ranks the highest alphas descending in a 3-column format (symbol, value, emoji), with header branding for focused opportunity highlighting.
– Array-Based Sorting: Generates descending indices from alpha array, reconstructing sorted lists for leaderboard extraction while preserving originals for display.
🔔 Alerts
– Dynamic Alert Construction: Compiles a newline-separated list of symbols and rounded alphas on the last bar, stripping prefixes for clean formatting.
– Once-Per-Bar Frequency: Triggers alerts at close with the complete dataset, facilitating external integrations like notifications or automation.
– Content Customization: Formats messages for readability, excluding NA values to focus on actionable data points.
✅ Key Takeaways
– Streamlines alpha computation across portfolios, transforming complex risk-adjusted metrics into intuitive, gradient-scored tables for rapid insights.
– Benchmark-relative ranking with medians and tops enables proactive asset rotation based on true outperformance.
– Customizable symbols and lookbacks adapt to diverse crypto watches, from majors to niche alts.
– Visual emojis and colors provide at-a-glance sentiment, complementing numerical precision.
– Automated alerts deliver full-dataset updates, bridging analysis to actionable trading decisions.
Script protetto
Questo script è pubblicato come codice protetto. Tuttavia, è possibile utilizzarlo liberamente e senza alcuna limitazione – per saperne di più clicca qui.
Declinazione di responsabilità
Le informazioni ed i contenuti pubblicati non costituiscono in alcun modo una sollecitazione ad investire o ad operare nei mercati finanziari. Non sono inoltre fornite o supportate da TradingView. Maggiori dettagli nelle Condizioni d'uso.