PROTECTED SOURCE SCRIPT
Low Liquidity Marker
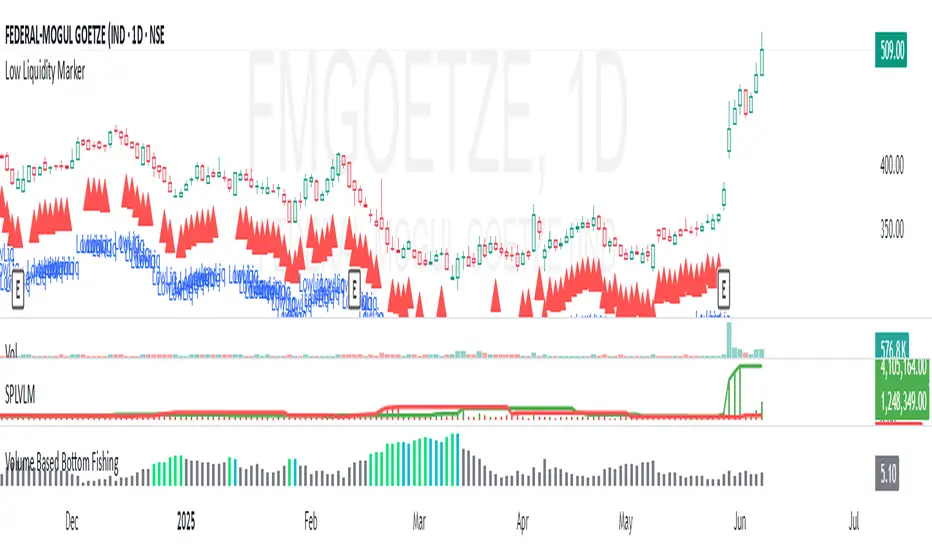
📘 Indicator Description – Low Liquidity Marker
The Low Liquidity Marker is a simple yet powerful tool designed to highlight candles where Volume × Low Price falls below a customizable threshold — signaling potential low liquidity zones on the chart.
🔍 How it works:
It calculates volume × low for each candle.
When this value drops below your defined threshold, a red triangle is plotted below that bar.
These bars may indicate poor institutional participation or market inefficiency.
⚠️ Why it matters:
Low liquidity makes it difficult to build or exit large positions efficiently.
Stocks or instruments flagged by this tool may be suitable for small capital investments but are generally unsuitable for high-volume or institutional-grade trading.
Use this indicator to filter out illiquid setups when screening for quality trades.
🛠 Customizable Input:
Volume × Low Threshold: Tune this parameter based on your instrument or trading timeframe.
💡 Ideal For:
Retail traders avoiding illiquid zones.
Investors wanting to identify where the market lacks sufficient depth.
Enhancing trade filters in systematic or discretionary setups.
Script protetto
Questo script è pubblicato come codice protetto. Tuttavia, è possibile utilizzarle liberamente e senza alcuna limitazione – ulteriori informazioni qui.
Declinazione di responsabilità
Le informazioni e le pubblicazioni non sono intese come, e non costituiscono, consulenza o raccomandazioni finanziarie, di investimento, di trading o di altro tipo fornite o approvate da TradingView. Per ulteriori informazioni, consultare i Termini di utilizzo.