OPEN-SOURCE SCRIPT
Discrete Fourier Transform Overlay [wbburgin]
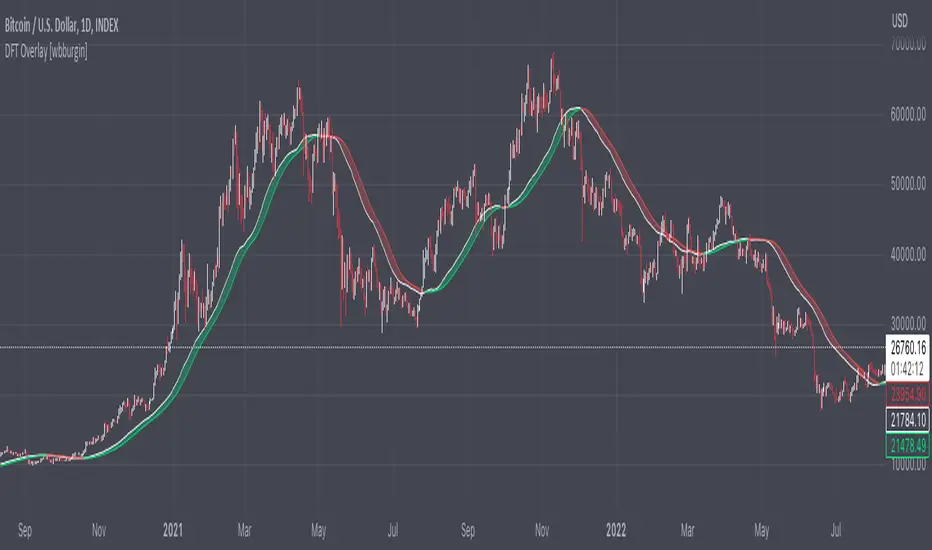
The discrete Fourier transform (DFT) overlay uses a discrete Fourier transform algorithm to identify trend direction. This is a simpler interpretation that only uses the magnitude of the first frequency component obtained from the DFT algorithm, but can be useful for visualization purposes. I haven't seen many Fourier scripts on TradingView that actually have the magnitude plotted on the chart (some have lines, for instance, but that makes it difficult to look into the past or to see previous lines).
About the Discrete Fourier Transform
The DFT is a mathematical transformation that decomposes a time-domain signal into its constituent frequency components. By applying the DFT to OHLC data, we can interpret the periodicities and trends present in the market. I've designed the overlay so that you can choose your source for the Fourier transform, as well as the length.
Settings and Configuration
The "Fourier Period" is the transform length of the DFT algorithm. This input indicates the number of data points considered for the DFT calculation. For example, if this input is set to 20, the DFT will be performed on the most recent 20 data points of the input series. The transform length affects the resolution and accuracy of the frequency analysis. A shorter transform length may provide a broader frequency range but with less detail, while a longer transform length can provide finer frequency resolution but may be computationally more intensive (I recommend using under 100 - anything above that might take too much time to load on the platform).
The "Fourier X Series" is the source you want the Fourier transform to be applied to. I have it set in default to the close.
"Kernel Smoothing" is the bar-start of the rational quadratic kernel used to smooth the frequency component. Think of it just like a normal moving average if you are unfamiliar with the concept, it functions similarly to the "length" value of a moving average.
Script open-source
In pieno spirito TradingView, il creatore di questo script lo ha reso open-source, in modo che i trader possano esaminarlo e verificarne la funzionalità. Complimenti all'autore! Sebbene sia possibile utilizzarlo gratuitamente, ricorda che la ripubblicazione del codice è soggetta al nostro Regolamento.
FAQ: I am gradually phasing out my Patreon because of the time it takes to maintain.
BTC: 35PdMMMXFCvPjXKwn8wsRFNwMEPgStaKUJ
Test my strategies on CryptoRobotics: cryptorobotics.co/?trade=f23b09
BTC: 35PdMMMXFCvPjXKwn8wsRFNwMEPgStaKUJ
Test my strategies on CryptoRobotics: cryptorobotics.co/?trade=f23b09
Declinazione di responsabilità
Le informazioni ed i contenuti pubblicati non costituiscono in alcun modo una sollecitazione ad investire o ad operare nei mercati finanziari. Non sono inoltre fornite o supportate da TradingView. Maggiori dettagli nelle Condizioni d'uso.