PROTECTED SOURCE SCRIPT
Hossa + Fear & Greed Combo [by Adi]
This analytical tool combines two market assessment methods:
1. Bull Market — analysis of a potential “bull market” phase (growth and euphoria phase) and the risk of its end or the emergence of a speculative bubble.
2. Fear & Greed Index — a market sentiment indicator based on RSI and volume, showing levels of extreme fear or greed.
The script displays signals, chart backgrounds, information panels, and generates alerts for important market situations.
Details of each part
1. Input Parameters
• Bull Market:
o h_rsiLength — RSI length (default 14).
o h_rsiOverbought — RSI overbought level (default 70).
o h_maLength — moving average (MA) length (default 20).
o h_volLookback — volume average lookback period (10).
o h_bubbleMult — volume multiplier to detect a bubble (1.5).
o h_accelLookback — lookback period for price acceleration detection (5).
o Options to show signals, background, panel, and trend strength bar.
• Fear & Greed:
o fg_rsiLength — RSI length (14).
o fg_volLength — volume average length (20).
o Option to show colored background.
2. Bull Market Calculations
• RSI based on closing price.
• MA based on closing price.
• Average volume.
• Price acceleration (percentage price change relative to 5 bars ago).
Based on these, phases are defined as:
• Euphoria: RSI > 70 and price > MA — strong growth, potential bull market.
• Risk zone: RSI > 70 but price below MA and declining volume — possible bull market end.
• Speculative bubble: rapid price increase (>10% in 5 bars) and high volume (>1.5x average) — risk of a “bubble.”
The script also calculates how many days the current bull market has lasted and estimates the average length of previous euphoria phases and the probability of its end.
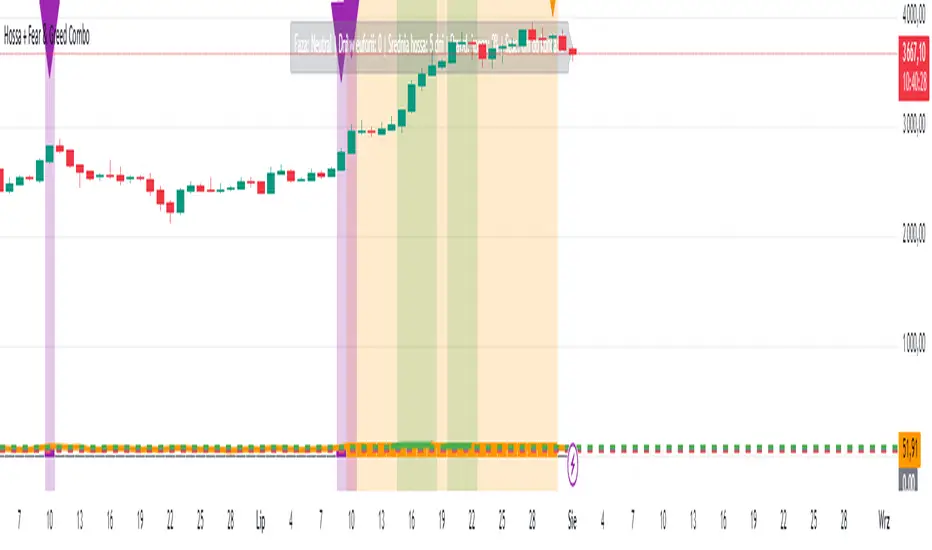
3. Bull Market Visualization
• Colored backgrounds on the chart: orange (euphoria), red (risk), purple (bubble).
• Chart markers (triangles) indicating risk of bull market end and bubble.
• Text panel showing current market state (phase, duration, average bull market length, probability, and estimated time to end).
• Histogram bar showing trend strength (orange, red, purple, or gray).
4. Bull Market Alerts
• Alert for possible bull market end.
• Alert for detected speculative bubble.
• Alert for exiting the euphoria phase.
5. Fear & Greed Calculations
• Calculation of RSI and volume (relative to average) to derive the market sentiment index.
• Index normalized to range 0–100, where:
o <25 = extreme fear,
o 25–75 = neutral,
o 75 = extreme greed.
6. Fear & Greed Visualization
• Colored background (red for fear, green for greed).
• Histogram of the index with horizontal lines at 25, 50, and 75.
• Alerts for extreme values (fear <25, greed >75).
Summary
The script allows comprehensive market analysis combining:
• Technical assessment of upward trends and possible turning points (bull market, bubble, risk of bull market end).
• Psychological evaluation of investor sentiment (Fear & Greed Index).
This helps traders gain a clearer picture of whether the market is in euphoria or approaching a correction or crash.
The script works best on the daily timeframe (1D).
1. Bull Market — analysis of a potential “bull market” phase (growth and euphoria phase) and the risk of its end or the emergence of a speculative bubble.
2. Fear & Greed Index — a market sentiment indicator based on RSI and volume, showing levels of extreme fear or greed.
The script displays signals, chart backgrounds, information panels, and generates alerts for important market situations.
Details of each part
1. Input Parameters
• Bull Market:
o h_rsiLength — RSI length (default 14).
o h_rsiOverbought — RSI overbought level (default 70).
o h_maLength — moving average (MA) length (default 20).
o h_volLookback — volume average lookback period (10).
o h_bubbleMult — volume multiplier to detect a bubble (1.5).
o h_accelLookback — lookback period for price acceleration detection (5).
o Options to show signals, background, panel, and trend strength bar.
• Fear & Greed:
o fg_rsiLength — RSI length (14).
o fg_volLength — volume average length (20).
o Option to show colored background.
2. Bull Market Calculations
• RSI based on closing price.
• MA based on closing price.
• Average volume.
• Price acceleration (percentage price change relative to 5 bars ago).
Based on these, phases are defined as:
• Euphoria: RSI > 70 and price > MA — strong growth, potential bull market.
• Risk zone: RSI > 70 but price below MA and declining volume — possible bull market end.
• Speculative bubble: rapid price increase (>10% in 5 bars) and high volume (>1.5x average) — risk of a “bubble.”
The script also calculates how many days the current bull market has lasted and estimates the average length of previous euphoria phases and the probability of its end.
3. Bull Market Visualization
• Colored backgrounds on the chart: orange (euphoria), red (risk), purple (bubble).
• Chart markers (triangles) indicating risk of bull market end and bubble.
• Text panel showing current market state (phase, duration, average bull market length, probability, and estimated time to end).
• Histogram bar showing trend strength (orange, red, purple, or gray).
4. Bull Market Alerts
• Alert for possible bull market end.
• Alert for detected speculative bubble.
• Alert for exiting the euphoria phase.
5. Fear & Greed Calculations
• Calculation of RSI and volume (relative to average) to derive the market sentiment index.
• Index normalized to range 0–100, where:
o <25 = extreme fear,
o 25–75 = neutral,
o 75 = extreme greed.
6. Fear & Greed Visualization
• Colored background (red for fear, green for greed).
• Histogram of the index with horizontal lines at 25, 50, and 75.
• Alerts for extreme values (fear <25, greed >75).
Summary
The script allows comprehensive market analysis combining:
• Technical assessment of upward trends and possible turning points (bull market, bubble, risk of bull market end).
• Psychological evaluation of investor sentiment (Fear & Greed Index).
This helps traders gain a clearer picture of whether the market is in euphoria or approaching a correction or crash.
The script works best on the daily timeframe (1D).
Script protetto
Questo script è pubblicato come codice protetto. Tuttavia, è possibile utilizzarle liberamente e senza alcuna limitazione – ulteriori informazioni qui.
Declinazione di responsabilità
Le informazioni e le pubblicazioni non sono intese come, e non costituiscono, consulenza o raccomandazioni finanziarie, di investimento, di trading o di altro tipo fornite o approvate da TradingView. Per ulteriori informazioni, consultare i Termini di utilizzo.