PROTECTED SOURCE SCRIPT
Yield curve indicator trial
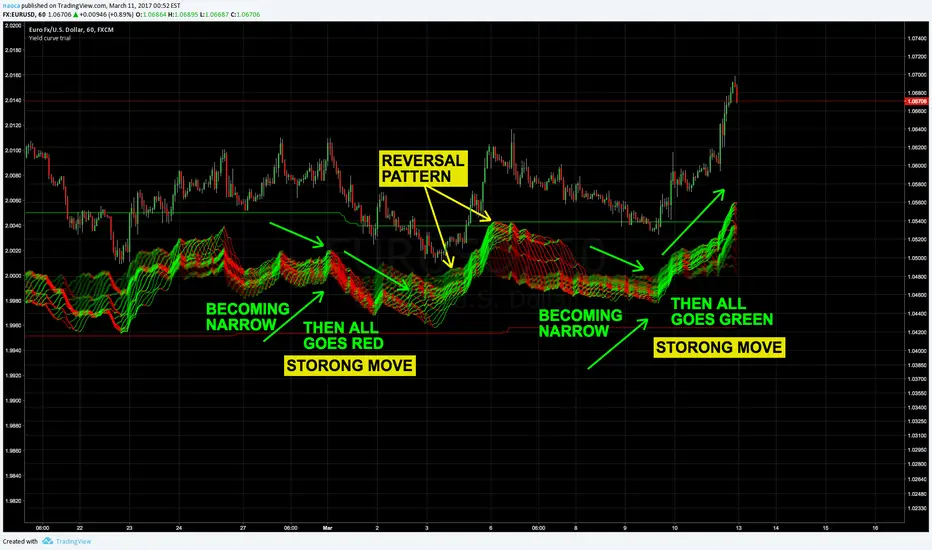
This indicator shows the multiple time frame yield curves of chart.
It’s useful to understand how much good or bad is the performance for short-term & long-term traders.
Near side of lines indicates longer term yield.
And far side of lines indicates shorter term of yield.
While it’s ascending, its color is green & if not it will be red.
- - - - - - - - - - - - - - - - - - - - - - - - - - - - - -
This is trial version. You can check how it works on any chart!
* Data before March. 17th, 2017 can be shown.
More information:
tradeindicator.tumblr.com/post/158257399947/yield-curve-indicator
tradeindicator.tumblr.com/
Script protetto
Questo script è pubblicato come codice protetto. Tuttavia, è possibile utilizzarle liberamente e senza alcuna limitazione – ulteriori informazioni qui.
Declinazione di responsabilità
Le informazioni e le pubblicazioni non sono intese come, e non costituiscono, consulenza o raccomandazioni finanziarie, di investimento, di trading o di altro tipo fornite o approvate da TradingView. Per ulteriori informazioni, consultare i Termini di utilizzo.