OPEN-SOURCE SCRIPT
Aggiornato Multi Indicator Buy/Sell with Backtest
This backtest indicator allows you to configure up to 4 different indicators and set buy/sell levels for each one, then back test how well your strategy would have worked over a given time period.
Note di rilascio
This backtest indicator allows you to configure up to 4 different indicators and set buy/sell levels for each one, then back test how well your strategy would have worked over a given time period.My original ROI calculation did not re-invest the profit correctly. I updated the script so the script now simulates placing each buy based on the configured percentage of the original dollar amount. Then when cash on hand surpasses the original dollar amount the amount used per buy gets re-calculated based on the new amount available.
So if you start with $10,000, and choose 50% per trade. And after a few trades you end up with $15,000 waiting for a buy, it will start using 50% of that $15,000 to make the next buy instead of just 50% of the original $10,000. This feels like a more accurate and real world representation of how someone would expect the results to be calculated.
Note di rilascio
Added feature to display buy and sell amounts, which makes it easier to double check the script and know what it is doing.Note di rilascio
Added a couple of features, the ability to see the trades in $ and Asset, and the ability to change how the trading bag is deployed during the test.Note di rilascio
Fixed a buy-in calculation bug, and added a new buy-in method. You can now choose to calculate the buys based on these options:% Original: Fixed % of starting equity, doesn't change.
% Available: % of max equity adjusted up when total cash increases.
% Stepped: Each buy is increased by the chosen % of last buy.
% Multiple: Each buy is an increased multiple of the initial buy.
The sells remain FIFO
Note di rilascio
I got an email saying my description of this script wasn't good enough. So i'll try and add some more detail on this update.This particular update turns the Hits Required setting into Bars Required, which I think is far more useful. It also calculates the average number of trades per month you would end up having to perform.
Now for some overall details on what this script does:
This script is designed to allow the user to easily perform a variety of back tests allowing them to figure out how any given trading theory they have would have worked in the past.
The big limitation this script has is that each indicator it looks at has to produce a fixed range of numbers, it cannot adjust or follow the price like the MA or Bollinger Bands. Those indicators must first be converted into a fixed range of numbers by some other script.
Another limitation is that this script can only use indicators already present on the layout. I was unable to get pinescript 6 to work which seems to have the ability to reference indicators which are not present.
This script has settings that are divided into 5 sections. The first 4 sections are copies of each other. They consist of a:
- Source (which is a data feed from another indicator in the layout)
- Overbought and Oversold levels (which are numeric values that tell the script to trip a buy or sell signal when the indicator crosses over). It is important that the value goes just beyond the configured value to trigger the action, just hitting it is not enough.
- Bars Required (which tell the script to only trigger the signal if the value has remained crossed for a certain number of bars. By setting this value to 0 you can effectively turn off, or tell the script to ignore the values for that Threshold.
Those settings are repeated 4 times, and they work as an AND sequence. So all of your configured Sources have to cross their configured values before a buy or sell signal is triggered.
The last section in the settings is the Backtest configuration. While buy and sell signals are nice, it is even better if you can test strategies using those signals. So this section allows you to try out a few different buy and sell strategies.
- Starting Equity: The amount of money you plan to start with for this trading bag.
- Position Size: a percentage of the equity that will be used for the trades. This percent is used in different manners depending on the choice made in Buy-In Type.
- Buy-In Type: currently there are 4 different options here, Original, Available, Stepped, Multiple
- - Original: Makes a buy using the configured percentage of the starting equity, that buy amount never changes no matter how much money is made.
- - Available: just like original, except that whenever the cash on hand is greater than we started with, it adjusts the buy amount to be the configured percentage of that new greater amount.
- - Stepped: just like Available except that it adds the configured percentage of itself to itself if the next buy is lower than the last one, and it subtracts that from itself if the next buy is greater than the last one. However it never buys less than the configured percentage.
- - Multiple: just liked Stepped except that instead of adding and subtracting a percentage of itself to itself, it adds and subtracts a multiple of the original buy amount.
- Start Date / End Date: the date range you want to flash buy/sell signals for and perform a back test on. Useful if the asset has changed how it performs and you want to target it's performance during a specific period of its history.
- Timing: Begin/End indicates whether you want the buy/sell signals to trigger as soon as all your conditions are met, or at the end of the period during which they were met.
- Show Labels: None/USD/Asset, in addition to the buy and sell signals, you can display when the backtest actually had money left and took action on one of those signals, as well as the amount of the asset purchased, or the dollars used to make the purchase. This really helps make it clear what the backtest is doing.
There are no configurable options for sells. The are processed in a FIFO (first in first out) manner. So the amount of the asset purchased is the amount that gets sold, in order, for each sell signal.
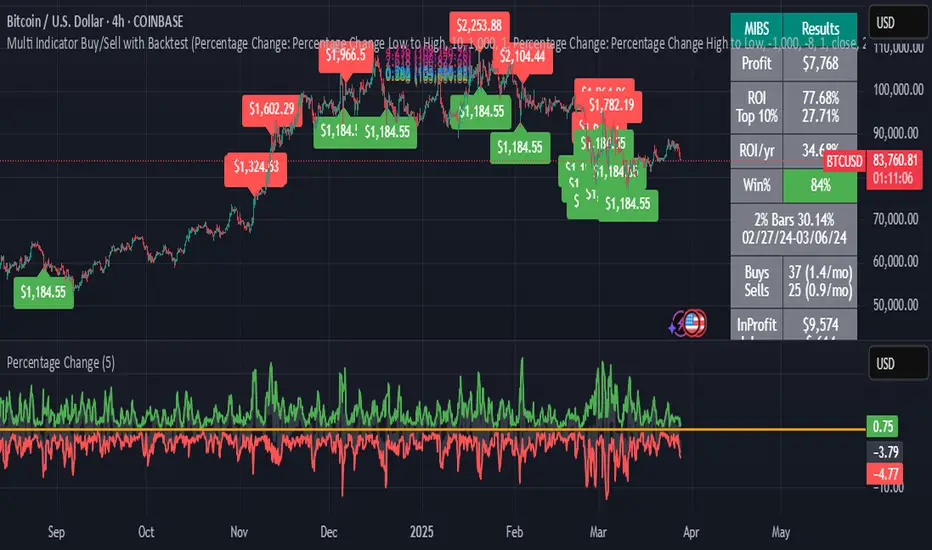
The screenshot shows the resulting table of data the back test produces in addition to the buy/sell flags on the graph itself. In this table you have:
- Profit: The cash profit made from successful trades.
- ROI: The total return on investment made throughout the entire tested date range.
- ROI/yr: The amount of ROI averaged by year. So the ROI is divided by the number of days tested, then multiplied by 365 to display the equivalent yearly amount.
- Win%: since sells are performed FIFO, the scripts tracks if the sell price is greater than the buy price for that transaction. This is a percentage of how often that buy/sell pair was profitable.
- Buys/Sells: The number of buys and sells performed over the tested period. Also includes a averaged calculation for the number performed per month to help visualize the effort required.
- Initial: the configured starting equity, also the number of shares of the asset that could have been purchased on the very first buy flag if the entire amount had been used. For exponential assets it helps determine if the strategy is better than just buying dips and holding over time.
- Open: The value of the shares still open that have not yet had sell signals.
- Cash: The amount of cash currently available to be placed on the next trade.
- Total: The total value of the bag at the end of the test. Also includes a calculation of how many shares that total value could purchase at the current share price.
Unfortunately this back test does not handle failure well, so if you have a failing strategy it will just run out of money. The values on the resulting chart may also be a bit misleading if the strategy began failing but has not yet sold the asset.
This backtest was inspired by the one written by Invest Answers, and seeks to improve on that original idea.
Note di rilascio
I have made several rather large improvements to the script for this version, I am going to try and remember them all.The biggest note though is that I have had some odd issues with the new %Bars calculation, the calculation works but TradingView has built in limitations that have caused it to break. I believe I have worked through all the issues and put enough restrictions on the calculation so it doesn't hit those TradingView limits, however if you leave your window open all night and find the script has errored, just refresh your page. Worse case you can set the % value to 0 to turn off the calculation all together if it ends up causing you problems.
Now for the list of changes:
- Table Display: a new visual setting allow you to change how the display table looks. I did this primarily for those who have lots of indicators on their screen and want the values displayed more horizontal than vertical, especially considering how much data is now in this thing.
- - Tall: the original vertical appearance
- - Wide: more of a square shape
- - Wider: mostly horizontal in appearance
- Table Position: where on your screen do you want the table to be displayed. No real reason for this one, just felt like it would be nice for the user to have the options.
- - Top Left
- - Top Center
- - Top Right (default)
- - Middle Left
- - Middle Center
- - Middle Right
- - Bottom Left
- - Bottom Center
- - Bottom Right
- Top Trade % : This is displayed on the table along with the ROI and is called Top X%. You configure the percentage you want it to look at, 10 by default, and it calculates how much of your ROI is concentrated in that % of trades. This allows you to determine if all your profit is due to a very small number of trades. If this value is greater than your overall ROI that means you've either had some trades with large losses, or you are currently in some trades that are underwater.
- Return Concentration Bar %: Similar to the top % calculation, this helps you determine if a large number of your winning trades are concentrated into a small time period. In other words, does your current configuration only work because you had a couple of really good trades. Again if this number is greater than your ROI it means you had some large losses somewhere.
- InProfit/InLoss: these are two new calculations in the display table. They add up all your current sells and total those which were profitable vs those which lost money. If InLoss is large compared to InProfit then your overall strategy is probably not working too well.
In addition to these changes I also added some background coloring of red and green for values I considered to be very good or very bad. These are not your goals, they aren't even my goals, they are just values I tried to create to pick out some of the better or worse values so the user can see them very quickly.
- InLoss more than half of InProfit (turns red)
- Win% more than 80 turns green, less than 70 turns red
- % Bars cell turns red if it is more than half of the overall ROI
- ROI/yr is green if it is over 100, and red if it is less than 10
- Top X% turns red if it is more than half of the overall ROI.
Note di rilascio
I wasn't planning on publishing this update until I had used the script more, but i'm taking a break from it for a bit, and the couple of changes I added seem rather nice for other people to have.I adjusted the way that the backtest handles a date range that ends before the current bar. It now "unwinds" any buys that don't have a matching sell.
This hopefully gives a more accurate picture of the profit for that time range. The downside is that since this action is performed on the last bar, a trading view limitation will blow up the script if that final date is more than 5k bars back. I may fix this some day, but i'm guessing this scenario is not going to be common for most people.
Another small change is separating the overbought and oversold checks inside each Threshold. This allows you to set a ridiculously high or low number for a given field, essentially taking it out of the equation. Useful if you want a given source to be used for only buys or only sells.
The other big change is that I added a new Backtest setting:
Sell Percentage - While selling is still FIFO, this allows you to control how much of a given position you want to sell. So you could set it to 50% and only sell half of a position at each sell signal. Or you could set it to 200% to sell two positions at once on a signal.
Script open-source
Nello spirito di TradingView, l'autore di questo script lo ha reso open source, in modo che i trader possano esaminarne e verificarne la funzionalità. Complimenti all'autore! Sebbene sia possibile utilizzarlo gratuitamente, ricordiamo che la ripubblicazione del codice è soggetta al nostro Regolamento.
Declinazione di responsabilità
Le informazioni e le pubblicazioni non sono intese come, e non costituiscono, consulenza o raccomandazioni finanziarie, di investimento, di trading o di altro tipo fornite o approvate da TradingView. Per ulteriori informazioni, consultare i Termini di utilizzo.