OPEN-SOURCE SCRIPT
Example of Code for Moving Average Cross - Changing Colors
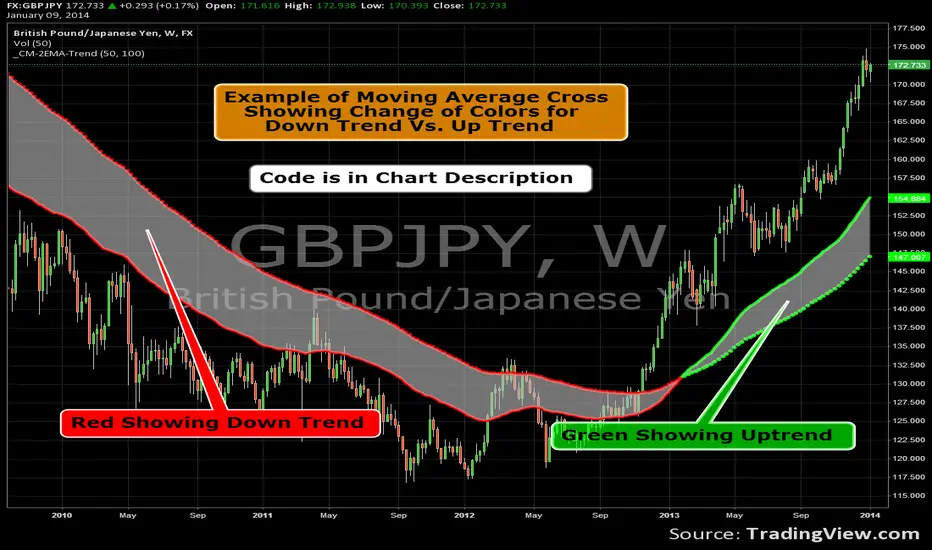
Famous 7 Time World Trading Champion Chuck Hughes found the 50 and 100 EMA to be the best Signal for a Change in Trend. Through extensive back-testing he found these EMA’s to give the earliest signal that also resulted in a Long-Term Change in Trend.
Dotted Line represents Long-Term EMA. The 100 EMA in this example.
Solid line represents the Short-Term EMA. The 50 EMA in this example.
If Short-Term EMA is ABOVE Long-Term EMA...Color = Green.
If Short-Term EMA is BELOW Long-Term EMA...Color = Red.
Dotted Line represents Long-Term EMA. The 100 EMA in this example.
Solid line represents the Short-Term EMA. The 50 EMA in this example.
If Short-Term EMA is ABOVE Long-Term EMA...Color = Green.
If Short-Term EMA is BELOW Long-Term EMA...Color = Red.
Script open-source
In pieno spirito TradingView, il creatore di questo script lo ha reso open-source, in modo che i trader possano esaminarlo e verificarne la funzionalità. Complimenti all'autore! Sebbene sia possibile utilizzarlo gratuitamente, ricorda che la ripubblicazione del codice è soggetta al nostro Regolamento.
Coming Soon: ChrisMoodyTrading.com
Declinazione di responsabilità
Le informazioni ed i contenuti pubblicati non costituiscono in alcun modo una sollecitazione ad investire o ad operare nei mercati finanziari. Non sono inoltre fornite o supportate da TradingView. Maggiori dettagli nelle Condizioni d'uso.