OPEN-SOURCE SCRIPT
Filtered Swing Pivot S&R )
Pivot support and resis🔍 Filtered Swing Pivot S&R - Overview
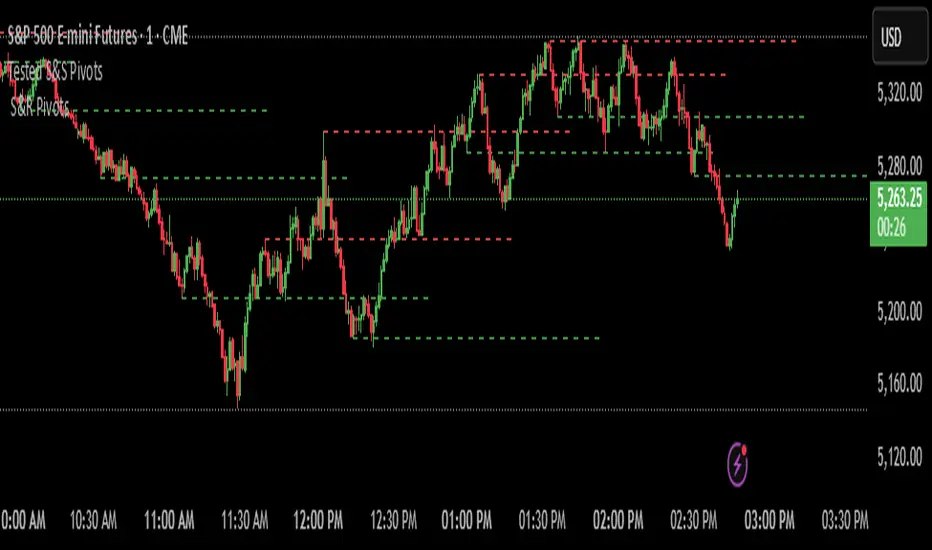
This indicator identifies and plots tested support and resistance levels using a filtered swing pivot strategy. It focuses on high-probability zones where price has reacted before, helping traders better anticipate future price behavior.
It filters out noise using:
Customizable pivot detection logic
Minimum price level difference
ATR (Average True Range) volatility filter
Confirmation by price retesting the level before plotting
⚙️ Core Logic Explained
✅ 1. Pivot Detection
The script uses Pine Script's built-in ta.pivothigh() and ta.pivotlow() functions to find local highs (potential resistance) and lows (potential support).
Pivot Lookback/Lookahead (pivotLen):
A pivot is confirmed if it's the highest (or lowest) point within a lookback and lookahead range of pivotLen bars.
Higher values = fewer, stronger pivots.
Lower values = more, but potentially noisier levels.
✅ 2. Pending Pivot Confirmation
Once a pivot is detected:
It is not drawn immediately.
The script waits until price re-tests that pivot level. This retest confirms the market "respects" the level.
For example: if price hits a previous high again, it's treated as a valid resistance.
✅ 3. Dual-Level Filtering System
To reduce chart clutter and ignore insignificant levels, two filters are applied:
Fixed Threshold (Minimum Level Difference):
Ensures a new pivot level is not too close to the last one.
ATR-Based Filter:
Dynamically adjusts sensitivity based on current volatility using the formula:
java
Copy
Edit
Minimum distance = ATR × ATR Multiplier
Only pivots that pass both filters are plotted.
✅ 4. Line Drawing
Once a pivot is:
Detected
Retested
Filtered
…a horizontal dashed line is drawn at that level to highlight support or resistance.
Resistance: Red (default)
Support: Green (default)
These lines are:
Dashed for clarity
Extended for X bars into the future (user-defined) for forward visibility
🎛️ Customizable Inputs
Parameter Description
Pivot Lookback/Lookahead Bars to the left and right of a pivot to confirm it
Minimum Level Difference Minimum price difference required between plotted levels
ATR Length Number of bars used in ATR volatility calculation
ATR Multiplier for Pivot Multiplies ATR to determine volatility-based pivot separation
Line Extension (bars) How many future bars the level line will extend for better visibility
Resistance Line Color Color for resistance lines (default: red)
Support Line Color Color for support lines (default: green)
📈 How to Use It
This indicator is ideal for:
Identifying dynamic support & resistance zones that adapt to volatility.
Avoiding false levels by waiting for pivot confirmation.
Visual guidance for entries, exits, stop placements, or take-profits.
🔑 Trade Ideas:
Use support/resistance retests for entry confirmations.
Combine with candlestick patterns or volume spikes near drawn levels.
Use in confluence with trendlines or moving averages.
🚫 What It Does Not Do (By Design)
Does not repaint or remove past levels once confirmed.
Does not include labels or alerts (but can be added).
Does not auto-scale based on timeframes (manual tuning recommended).
🛠️ Possible Enhancements (Optional)
If desired, you could extend the functionality to include:
Labels with “S” / “R”
Alert when a new level is tested or broken
Toggle for support/resistance visibility
Adjustable line width or style
tance indicator
Script open-source
Nello spirito di TradingView, l'autore di questo script lo ha reso open source, in modo che i trader possano esaminarne e verificarne la funzionalità. Complimenti all'autore! Sebbene sia possibile utilizzarlo gratuitamente, ricordiamo che la ripubblicazione del codice è soggetta al nostro Regolamento.
Declinazione di responsabilità
Le informazioni e le pubblicazioni non sono intese come, e non costituiscono, consulenza o raccomandazioni finanziarie, di investimento, di trading o di altro tipo fornite o approvate da TradingView. Per ulteriori informazioni, consultare i Termini di utilizzo.