PROTECTED SOURCE SCRIPT
Valuation Bands (Dynamic + Table)
Valuation Bands (Dynamic + Table)
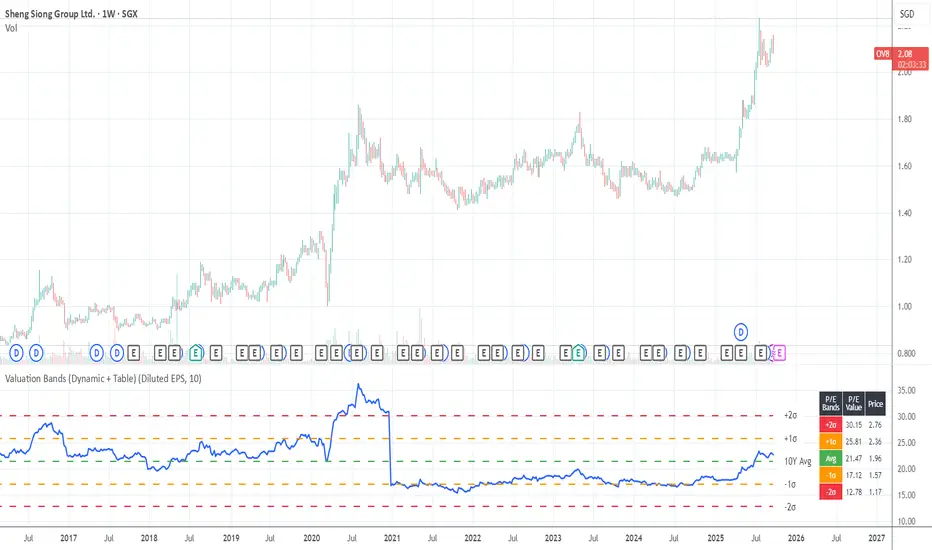
This indicator helps investors assess whether a stock is trading at cheap, fair, or expensive levels relative to its historical valuation multiples. It dynamically calculates valuation ratios such as P/E, P/B, P/S, P/Operating Income, P/Cash Flow, or Dividend Yield over a customizable lookback period (e.g., 10 years).
Using these ratios, the script plots the long-term average alongside ±1σ and ±2σ standard deviation bands, highlighting valuation zones. The included data table displays both the multiple values and their corresponding price levels, making it easy to interpret fair value ranges.
Alerts are built in to notify when the current ratio crosses into undervalued (–2σ) or overvalued (+2σ) zones, helping investors spot potential opportunities or risks.
In short, this tool bridges fundamentals with technical visualization, giving a quick snapshot of how today’s valuation compares to historical norms.
Script protetto
Questo script è pubblicato come codice protetto. Tuttavia, è possibile utilizzarle liberamente e senza alcuna limitazione – ulteriori informazioni qui.
Declinazione di responsabilità
Le informazioni e le pubblicazioni non sono intese come, e non costituiscono, consulenza o raccomandazioni finanziarie, di investimento, di trading o di altro tipo fornite o approvate da TradingView. Per ulteriori informazioni, consultare i Termini di utilizzo.