OPEN-SOURCE SCRIPT
Hull-Exponential Moving Average (HEMA)
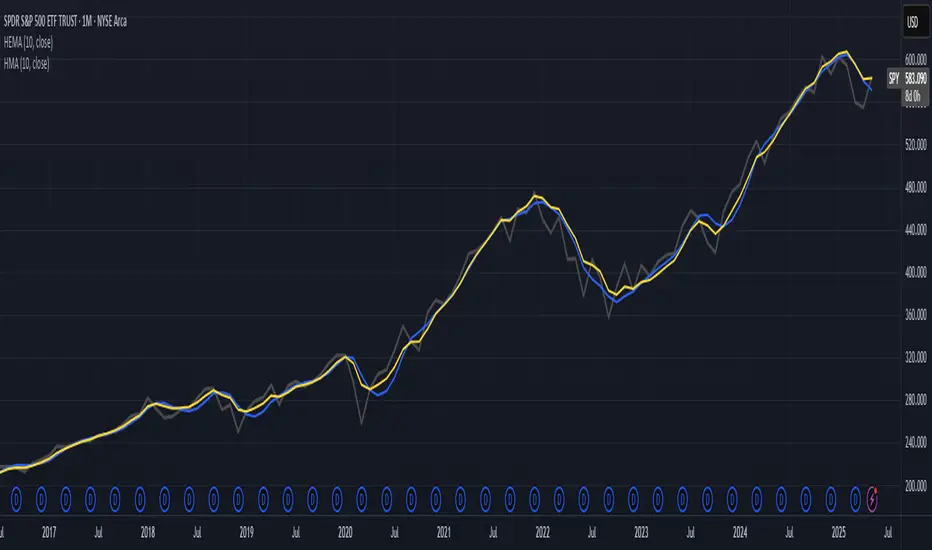
The Hull Exponential Moving Average (HEMA) is an experimental technical indicator that uses a sequence of Exponential Moving Averages (EMAs) with the same logic as HMA - except with EMAs and not WMAs. It aims to create a responsive yet smooth trend indicator than HMA.
HEMA applies a multi-stage EMA process. Initial EMAs are calculated using alphas derived from logarithmic relationships and the input period. Their outputs are then combined in a de-lagging step, which itself uses a logarithmically derived ratio. A final EMA smoothing pass is then applied to this de-lagged series. This creates a moving average that responds quickly to genuine price changes while maintaining effective noise filtering. The specific alpha calculations and the de-lagging formula contribute to its balance between responsiveness and smoothness.
▶️ **Core Concepts**
HEMA achieves its characteristics through this multi-stage EMA process, where the specific alpha calculations and the de-lagging step are key to its responsiveness and smoothness.
▶️ **Common Settings and Parameters**
Pro Tip: The HEMA's behavior is sensitive to the **Period** setting due to the non-linear relationships in its alpha calculations. Experiment with values around your typical MA periods. Small changes in **N** can have a noticeable impact, especially for smaller **N** values.
▶️ **Calculation and Mathematical Foundation**
Simplified explanation:
HEMA calculates its value through a sequence of three Exponential Moving Averages (EMAs) with specially derived smoothing factors (alphas).
All internal EMAs use a warmup compensation mechanism for improved accuracy on early bars.
Technical formula (let **N** be the input period):
1. Alpha for the first EMA (slow component related):
αS = 3.0 / (2.0 * N - 1.0)
2. Lambda for **αS** (intermediate value):
λS = -ln(1.0 - αS)
Note: **αS** must be less than 1, which implies 2N-1 > 3 or N > 2 for **λS** to be well-defined without NaN from ln of non-positive number. The code uses nz() for robustness but the formula implies this constraint.
3. De-lagging ratio **r**:
r = ln(2.0) / (1.0 + ln(2.0))
(This is a constant, approximately 0.409365)
4. Alpha for the second EMA (fast component related):
αF = 1.0 - exp(-λS / r)
5. Alpha for the final EMA smoothing:
αFin = 2.0 / (sqrt(N) / 2.0 + 1.0)
6. Applying the stages:
8. Calculate the de-lagged series:
DeLag = (OutputF / (1.0 - r)) - (r * OutputS / (1.0 - r))
9. Calculate the final HEMA:
HEMA = EMA_internal(DeLag, αFin, eFin_state, emaFin_state)
🔍 Technical Note: The HEMA implementation uses a shared warmup period controlled by **aMin** (the minimum of **αS**, **αF**, **αFin**). During this period, each internal EMA stage still tracks its own decay factor (**eS**, **eF**, **eFin**) to apply the correct compensation. The **nz()** function is used in the code to handle potential NaN values from alpha calculations if **N** is very small (e.g., **N=1** would make **αS=3**, **1-αS = -2**, **ln(-2)** is NaN).
▶️ **Interpretation Details**
HEMA provides several key insights for traders:
HEMA is particularly effective for trend following strategies where both responsiveness and noise reduction are important. It provides earlier signals than traditional EMAs while exhibiting less whipsaw than standard HMA in choppy market conditions. The indicator excels at identifying the underlying trend direction while filtering out minor price fluctuations.
▶️ **Limitations and Considerations**
▶️ **References**
HEMA applies a multi-stage EMA process. Initial EMAs are calculated using alphas derived from logarithmic relationships and the input period. Their outputs are then combined in a de-lagging step, which itself uses a logarithmically derived ratio. A final EMA smoothing pass is then applied to this de-lagged series. This creates a moving average that responds quickly to genuine price changes while maintaining effective noise filtering. The specific alpha calculations and the de-lagging formula contribute to its balance between responsiveness and smoothness.
▶️ **Core Concepts**
- Logarithmically-derived alphas: Alpha values for the three EMA stages are derived using natural logarithms and specific formulas related to the input period **N**.
- Three-stage EMA process: The calculation involves:
An initial EMA (using **αS**) on the source data.
A second EMA (using **αF**) also on the source data.
A de-lagging step that combines the outputs of the first two EMAs using a specific ratio **r**.
A final EMA (using **αFin**) applied to the de-lagged series.
- Specific de-lagging formula: Utilizes a constant ratio **r = ln(2.0) / (1.0 + ln(2.0))** to combine the outputs of the first two EMAs, aiming to reduce lag.
- Optimized final smoothing: The alpha for the final EMA (**αFin**) is calculated based on the square root of the period **N**.
- Warmup compensation: The internal EMA calculations include a warmup mechanism to provide more accurate values from the initial bars. This involves tracking decay factors (**eS**, **eF**, **eFin**) and applying a compensation factor **1.0 / (1.0 - e_decay)** during the warmup period. A shared warmup duration is determined by the smallest alpha among the three stages.
HEMA achieves its characteristics through this multi-stage EMA process, where the specific alpha calculations and the de-lagging step are key to its responsiveness and smoothness.
▶️ **Common Settings and Parameters**
- Period (**N**): Default: 10 | Base lookback period for all alpha calculations | When to Adjust: Increase for longer-term trends and more smoothness, decrease for shorter-term signals and more responsiveness
- Source: Default: Close | Data point used for calculation | When to Adjust: Change to HL2, HLC3, or OHLC4 for different price representations
Pro Tip: The HEMA's behavior is sensitive to the **Period** setting due to the non-linear relationships in its alpha calculations. Experiment with values around your typical MA periods. Small changes in **N** can have a noticeable impact, especially for smaller **N** values.
▶️ **Calculation and Mathematical Foundation**
Simplified explanation:
HEMA calculates its value through a sequence of three Exponential Moving Averages (EMAs) with specially derived smoothing factors (alphas).
- Two initial EMAs are calculated from the source price, using alphas **αS** and **αF**.
- The outputs of these two EMAs are combined into a "de-lagged" series.
- This de-lagged series is then smoothed by a third EMA, using alpha **αFin**, to produce the final HEMA value.
All internal EMAs use a warmup compensation mechanism for improved accuracy on early bars.
Technical formula (let **N** be the input period):
1. Alpha for the first EMA (slow component related):
αS = 3.0 / (2.0 * N - 1.0)
2. Lambda for **αS** (intermediate value):
λS = -ln(1.0 - αS)
Note: **αS** must be less than 1, which implies 2N-1 > 3 or N > 2 for **λS** to be well-defined without NaN from ln of non-positive number. The code uses nz() for robustness but the formula implies this constraint.
3. De-lagging ratio **r**:
r = ln(2.0) / (1.0 + ln(2.0))
(This is a constant, approximately 0.409365)
4. Alpha for the second EMA (fast component related):
αF = 1.0 - exp(-λS / r)
5. Alpha for the final EMA smoothing:
αFin = 2.0 / (sqrt(N) / 2.0 + 1.0)
6. Applying the stages:
- **OutputS = EMA_internal(source, αS, eS_state, emaS_state)**
- **OutputF = EMA_internal(source, αF, eF_state, emaF_state)**
8. Calculate the de-lagged series:
DeLag = (OutputF / (1.0 - r)) - (r * OutputS / (1.0 - r))
9. Calculate the final HEMA:
HEMA = EMA_internal(DeLag, αFin, eFin_state, emaFin_state)
🔍 Technical Note: The HEMA implementation uses a shared warmup period controlled by **aMin** (the minimum of **αS**, **αF**, **αFin**). During this period, each internal EMA stage still tracks its own decay factor (**eS**, **eF**, **eFin**) to apply the correct compensation. The **nz()** function is used in the code to handle potential NaN values from alpha calculations if **N** is very small (e.g., **N=1** would make **αS=3**, **1-αS = -2**, **ln(-2)** is NaN).
▶️ **Interpretation Details**
HEMA provides several key insights for traders:
- When price crosses above HEMA, it often signals the beginning of an uptrend
- When price crosses below HEMA, it often signals the beginning of a downtrend
- The slope of HEMA provides insight into trend strength and momentum
- HEMA creates smooth dynamic support and resistance levels during trends
- Multiple HEMA lines with different periods can identify potential reversal zones
HEMA is particularly effective for trend following strategies where both responsiveness and noise reduction are important. It provides earlier signals than traditional EMAs while exhibiting less whipsaw than standard HMA in choppy market conditions. The indicator excels at identifying the underlying trend direction while filtering out minor price fluctuations.
▶️ **Limitations and Considerations**
- Experimental nature: As an experimental indicator, HEMA may behave differently from established HMA in certain market conditions
- Lag characteristics: While designed to reduce lag, HEMA may exhibit slightly more lag than HMA in some scenarios due to the long tail of EMA
- Mathematical complexity: The multi-stage calculation with specialized alpha parameters makes the behavior less intuitive to understand
- Parameter sensitivity: Performance can vary significantly with different period settings
- Complementary tools: Works best when combined with volume analysis or momentum indicators for confirmation
▶️ **References**
- Hull, A. (2005). "Hull Moving Average," Technical Analysis of Stocks & Commodities.
Script open-source
Nello spirito di TradingView, l'autore di questo script lo ha reso open source, in modo che i trader possano esaminarne e verificarne la funzionalità. Complimenti all'autore! Sebbene sia possibile utilizzarlo gratuitamente, ricordiamo che la ripubblicazione del codice è soggetta al nostro Regolamento.
github.com/mihakralj/pinescript
A collection of mathematically rigorous technical indicators for Pine Script 6, featuring defensible math, optimized implementations, proper state initialization, and O(1) constant time efficiency where possible.
A collection of mathematically rigorous technical indicators for Pine Script 6, featuring defensible math, optimized implementations, proper state initialization, and O(1) constant time efficiency where possible.
Declinazione di responsabilità
Le informazioni e le pubblicazioni non sono intese come, e non costituiscono, consulenza o raccomandazioni finanziarie, di investimento, di trading o di altro tipo fornite o approvate da TradingView. Per ulteriori informazioni, consultare i Termini di utilizzo.