OPEN-SOURCE SCRIPT
Double Top/Bottom Detector
Double Top/Bottom Detector Indicator Description
Overview
The Double Top/Bottom Detector is a technical analysis tool designed to automatically identify and label potential double top and double bottom patterns on price charts. By combining pivot point detection with configurable height tolerance and pullback depth criteria, this indicator helps traders visually spot possible trend reversal zones without manual drawing or guesswork.
Key Features
• Pivot Point Identification
The indicator uses a symmetric window approach to find true highs and lows. A pivot high is confirmed only when a bar’s high exceeds the highs of a specified number of bars both before and after it. Likewise, a pivot low is established when a bar’s low is the lowest in its surrounding window.
• Double Top and Double Bottom Detection
– Height Tolerance: Ensures that the two pivot points forming the pattern are within a user-defined percentage of each other.
– Pullback Depth: Measures the drop (for a double top) or the rise (for a double bottom) between the two pivot points and confirms that it meets a minimum percentage threshold.
• Automatic Drawing and Labeling
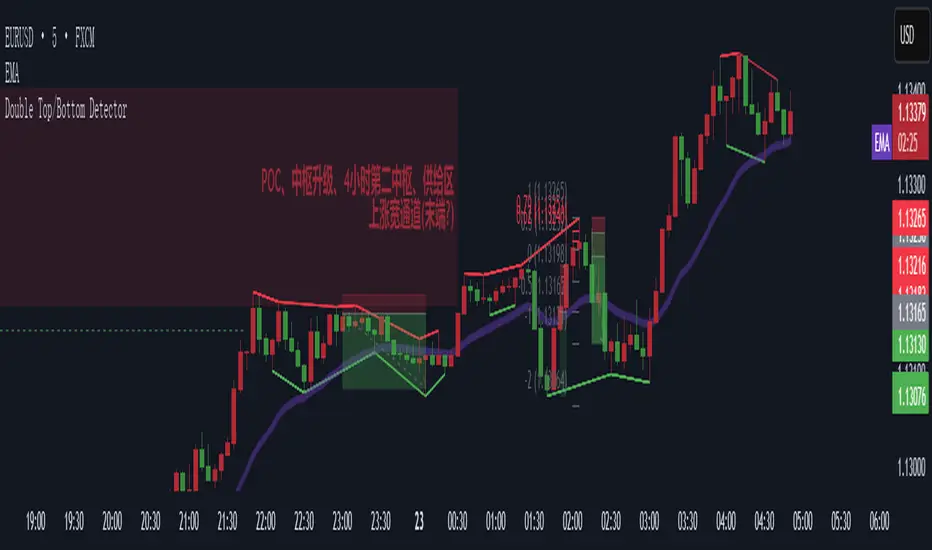
When a valid double top is detected, a red line connects the two pivot highs and a “Double Top” label is centered above the line. For a double bottom, a green line connects the two pivot lows and a “Double Bottom” label appears below the midpoint.
• Pivot Visualization for Debugging
Small red and green triangles mark every detected pivot high and pivot low on the chart, making it easy to verify and fine-tune settings.
Parameters
Height Tolerance (%) – The maximum allowable percentage difference between the two pivot heights (default 2.0).
Pullback Minimum (%) – The minimum required percentage pullback (for tops) or rebound (for bottoms) between the two pivots (default 5.0).
Pivot Lookback – The number of bars to look back and forward for validating pivot points (default 5).
Window Length – The number of bars over which to compute pullback extrema, equal to twice the pivot lookback plus one (default derived from pivot lookback).
Usage Instructions
1. Copy the Pine Script code into TradingView’s editor and select version 6.
2. Adjust the parameters based on the asset’s volatility and timeframe. A larger lookback window yields fewer but more reliable pivots; tighter height tolerance produces more precise pattern matches.
3. Observe the chart for red and green triangles marking pivot highs and lows. When two qualifying pivots occur, the indicator draws a connecting line and displays a descriptive label.
4. To extend the number of visible historical lines and labels, increase the max\_lines\_count and max\_labels\_count settings in the indicator declaration.
Customization Ideas
• Add volume or moving average filters to reduce false signals.
• Encapsulate pivot logic into reusable functions for cleaner code.
• Incorporate alert conditions to receive notifications when new double top or bottom patterns form.
This indicator is well suited for medium- to long-term analysis and can be combined with risk management rules to enhance decision making.
Overview
The Double Top/Bottom Detector is a technical analysis tool designed to automatically identify and label potential double top and double bottom patterns on price charts. By combining pivot point detection with configurable height tolerance and pullback depth criteria, this indicator helps traders visually spot possible trend reversal zones without manual drawing or guesswork.
Key Features
• Pivot Point Identification
The indicator uses a symmetric window approach to find true highs and lows. A pivot high is confirmed only when a bar’s high exceeds the highs of a specified number of bars both before and after it. Likewise, a pivot low is established when a bar’s low is the lowest in its surrounding window.
• Double Top and Double Bottom Detection
– Height Tolerance: Ensures that the two pivot points forming the pattern are within a user-defined percentage of each other.
– Pullback Depth: Measures the drop (for a double top) or the rise (for a double bottom) between the two pivot points and confirms that it meets a minimum percentage threshold.
• Automatic Drawing and Labeling
When a valid double top is detected, a red line connects the two pivot highs and a “Double Top” label is centered above the line. For a double bottom, a green line connects the two pivot lows and a “Double Bottom” label appears below the midpoint.
• Pivot Visualization for Debugging
Small red and green triangles mark every detected pivot high and pivot low on the chart, making it easy to verify and fine-tune settings.
Parameters
Height Tolerance (%) – The maximum allowable percentage difference between the two pivot heights (default 2.0).
Pullback Minimum (%) – The minimum required percentage pullback (for tops) or rebound (for bottoms) between the two pivots (default 5.0).
Pivot Lookback – The number of bars to look back and forward for validating pivot points (default 5).
Window Length – The number of bars over which to compute pullback extrema, equal to twice the pivot lookback plus one (default derived from pivot lookback).
Usage Instructions
1. Copy the Pine Script code into TradingView’s editor and select version 6.
2. Adjust the parameters based on the asset’s volatility and timeframe. A larger lookback window yields fewer but more reliable pivots; tighter height tolerance produces more precise pattern matches.
3. Observe the chart for red and green triangles marking pivot highs and lows. When two qualifying pivots occur, the indicator draws a connecting line and displays a descriptive label.
4. To extend the number of visible historical lines and labels, increase the max\_lines\_count and max\_labels\_count settings in the indicator declaration.
Customization Ideas
• Add volume or moving average filters to reduce false signals.
• Encapsulate pivot logic into reusable functions for cleaner code.
• Incorporate alert conditions to receive notifications when new double top or bottom patterns form.
This indicator is well suited for medium- to long-term analysis and can be combined with risk management rules to enhance decision making.
Script open-source
Nello spirito di TradingView, l'autore di questo script lo ha reso open source, in modo che i trader possano esaminarne e verificarne la funzionalità. Complimenti all'autore! Sebbene sia possibile utilizzarlo gratuitamente, ricordiamo che la ripubblicazione del codice è soggetta al nostro Regolamento.
Declinazione di responsabilità
Le informazioni e le pubblicazioni non sono intese come, e non costituiscono, consulenza o raccomandazioni finanziarie, di investimento, di trading o di altro tipo fornite o approvate da TradingView. Per ulteriori informazioni, consultare i Termini di utilizzo.