OPEN-SOURCE SCRIPT
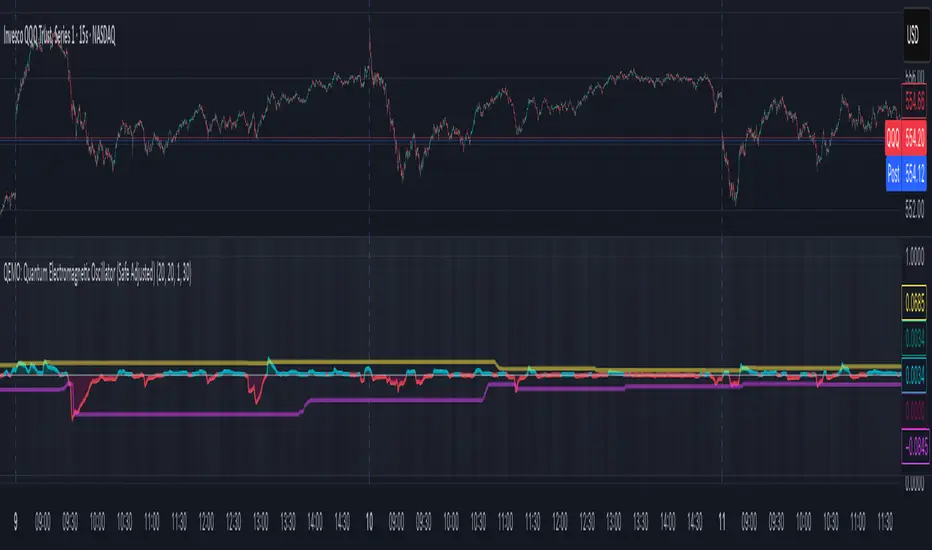
QEMO: Quantum Electromagnetic Oscillator (Safe Adjusted)
This is a highly conceptual and oscillator and It attempts to model market dynamics by borrowing concepts from quantum physics and electromagnetism to create a unique oscillator. It does not represent any real physical phenomena but uses these concepts as metaphors for market forces.
Here is a breakdown of its core components:
1. Quantum Price Wavefunction (The Core Price Engine)
This is the most abstract part of the script. It tries to model price not as a single point, but as a "wavefunction" representing a distribution of probable future prices.
Volatility & Price Grid: It first calculates recent market volatility. Based on this volatility, it creates a dynamic grid of possible price levels (price_bins) around the current price.
Probability Density: It assigns a probability to each price level in the grid.
"Energy" Operators:
Kinetic Energy: Metaphorically represents the "momentum" or rate of change of the price probabilities.
Potential Energy: A force field that influences the probabilities, derived from a combination of volatility and trading volume.
Expected Price: After evolving these probabilities, it calculates a single "expected price" which is the weighted average of all prices in the grid, based on their final probabilities.
2. Electromagnetic Fields (Buying vs. Selling Pressure)
This section models the battle between buyers and sellers in a more familiar way:
E-Field (Electric/Buying): Represents buying pressure, calculated from upward price moves (close - open) multiplied by volume.
B-Field (Magnetic/Selling): Represents selling pressure, calculated from downward price moves (open - close) multiplied by volume.
Lorentz Force (F_net): This is the net force (E - B), representing the overall directional pressure in the market. A positive value means buyers are in control; a negative value means sellers are.
3. Entanglement Entropy (Systemic Risk/Stability)
This component aims to measure the market's stability or "systemic risk."
It calculates a form of auto-correlation on recent price returns.
A high degree of instability in this correlation results in a high "Entropy" (S) value.
Essentially, a high S suggests the market is chaotic and unpredictable (low stability), while a low S suggests it is more stable and trending.
4. Final QEMO Calculation & Plotting
All the components are combined to create the final oscillator value:
Final Value: The qemo value is a product of the expected_price, the amplified net force, and the market stability (1 - S).
Smoothing: This raw qemo value is then smoothed with an Adaptive Moving Average (AMA) to produce the final line that gets plotted on the chart.
Visualization:
The main oscillator line is plotted below the chart. Its color changes based on its value (e.g., blue for positive, red for negative).
The background color of the indicator pane changes based on the Entropy (S), providing an immediate visual cue of market stability (e.g., black for stable, white for chaotic).
The script also plots 99th and 1st percentile bands to help identify statistically extreme readings in the oscillator's value.
Script open-source
Nello spirito di TradingView, l'autore di questo script lo ha reso open source, in modo che i trader possano esaminarne e verificarne la funzionalità. Complimenti all'autore! Sebbene sia possibile utilizzarlo gratuitamente, ricordiamo che la ripubblicazione del codice è soggetta al nostro Regolamento.
Declinazione di responsabilità
Le informazioni e le pubblicazioni non sono intese come, e non costituiscono, consulenza o raccomandazioni finanziarie, di investimento, di trading o di altro tipo fornite o approvate da TradingView. Per ulteriori informazioni, consultare i Termini di utilizzo.