OPEN-SOURCE SCRIPT
Aggiornato Tabular Portfolio by CJS V1
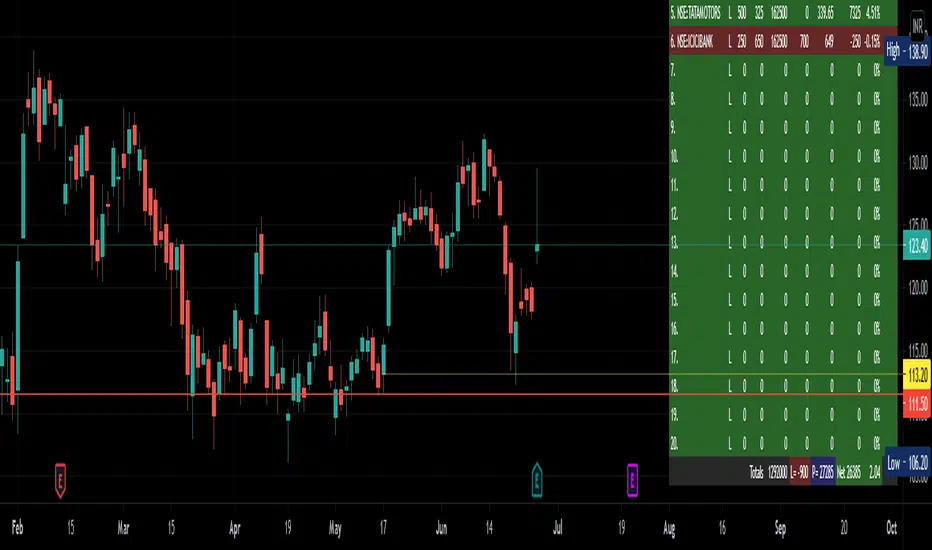
This is a useful indicator that sits on top of the charts, in the right hand bottom corner and shows the current price, profit or loss in value and percent of upto 20 scrips fed in, in a Tabular form using tables feature.
Allows to mark a/c id also if you have multiple broker or individual accounts.
Colors are customisable.
Stocks get updated no matter what is your current selected scrip.
Gives total investment and total PnL also in percent.
Useful to monitor your portfolio status in once screen and while you are looking at charts.
Give feedback for improvement or issues, if any.
Credits to RedKTrader from where the idea was picked up.
Move visual order to front, if the charts and other indicators overlap the table view.
Note di rilascio
This is a useful indicator that sits on top of the charts, in the right hand bottom corner and shows the current price, profit or loss in value and percent of upto 20 scrips fed in, in a Tabular form using tables feature.Allows to mark a/c id also if you have multiple broker or individual accounts.
Colors are customisable.
Stocks get updated no matter what is your current selected scrip.
Gives total investment and total PnL also in percent.
Useful to monitor your portfolio status in once screen and while you are looking at charts.
Give feedback for improvement or issues, if any.
Credits to RedKTrader from where the idea was picked up.
Move visual order to front, if the charts and other indicators overlap the table view.
Note di rilascio
- Some bugs removed.- Total PnL in case of short entries was wrong - corrected.
Added the following features:
1. A target price field added. The line turns blue when this target is achieved, signalling to book profit.
2. If no target is defined, there is a global profit, which when achieved, the line turns blue to signal to book profit. (only for those where target price is zero)
3. Amount invested in each scrip is shown (for Cash segment). For FnO, do your own judgement whether you consider to consider Margin / premium as invested amount or not. Basically shows total exposure.
4. Totals show bookable current profit of all positive PnLs in blue field (marked "P=" and total loss of all negative PnL in red field (marked "L=". Net PnL was as such being shown.
Note di rilascio
with a data populated image...Script open-source
In pieno spirito TradingView, il creatore di questo script lo ha reso open-source, in modo che i trader possano esaminarlo e verificarne la funzionalità. Complimenti all'autore! Sebbene sia possibile utilizzarlo gratuitamente, ricorda che la ripubblicazione del codice è soggetta al nostro Regolamento.
Declinazione di responsabilità
Le informazioni ed i contenuti pubblicati non costituiscono in alcun modo una sollecitazione ad investire o ad operare nei mercati finanziari. Non sono inoltre fornite o supportate da TradingView. Maggiori dettagli nelle Condizioni d'uso.
Script open-source
In pieno spirito TradingView, il creatore di questo script lo ha reso open-source, in modo che i trader possano esaminarlo e verificarne la funzionalità. Complimenti all'autore! Sebbene sia possibile utilizzarlo gratuitamente, ricorda che la ripubblicazione del codice è soggetta al nostro Regolamento.
Declinazione di responsabilità
Le informazioni ed i contenuti pubblicati non costituiscono in alcun modo una sollecitazione ad investire o ad operare nei mercati finanziari. Non sono inoltre fornite o supportate da TradingView. Maggiori dettagli nelle Condizioni d'uso.