PROTECTED SOURCE SCRIPT
Aggiornato Nasdaq 100 Logarithmic Growth Curves
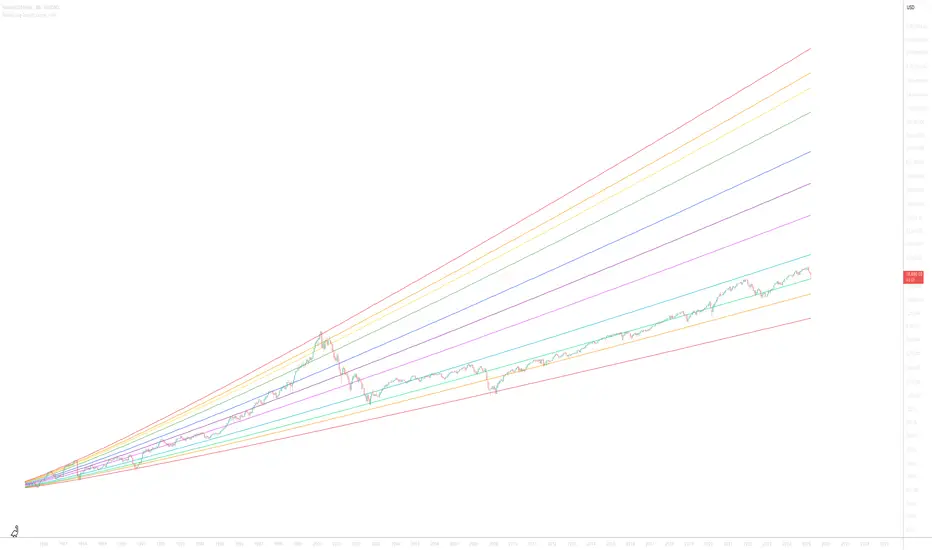
Introducing the Nasdaq 100 Logarithmic Growth Curves overlay indicator—a versatile, user-friendly Pine Script designed to transform how traders visualise stock market trends.
Born out of a need for a robust logarithmic overlay similar to those found on Bitcoin charts, this script precisely calibrates growth channels to the actual price levels of the Nasdaq 100 since launch in January, 1985.
Use the ticker: NASDAQ:NDX
Adjust for inflation with ticker:
NASDAQ:NDX-((ECONOMICS:USIRYY/1000)*NASDAQ:NDX)
The indicator offers dynamic customisation with options to choose different historical baselines—either from January 1985 or June 1998—and enables fine adjustments to the curve’s slopes and intercepts to suit varying market conditions.
In addition, the indicator includes optional Fibonacci retracement levels and projection curves, providing enriched context for both retrospective analysis and forward-looking trend estimation.
Let me know what you think below!
Ww
Log growth from June 1998
Note di rilascio
Pinecoders has informed the publication violated house rules due to improper description.The description below attempts to provide meaningful details so users can easily understand what your script does, how it does that, how to use it & how its original.
Nasdaq 100 Logarithmic Growth Curves - Script Description
=============================================
This indicator creates a set of logarithmic growth curves specifically calibrated for the Nasdaq 100 index, providing a long-term perspective on market cycles and potential price ranges.
Unlike standard trend lines or channels, these curves incorporate logarithmic growth functions to account for the exponential nature of market movements over extended periods.
How it works
=============================================
The indicator generates logarithmic curves based on historical Nasdaq 100 price action using the following methodology:
Logarithmic Function Foundation: The script calculates curves using the natural logarithm of days elapsed since a selected start date (either January 1985 or June 1998), combined with carefully calibrated slope and intercept parameters.
Mathematical Model: Each curve is generated using the formula:
LogValue = Intercept + log(DaysSinceStart + 100) * Slope * DaysSinceStart
ActualValue = exp(LogValue) * AdjustmentFactor
Fibonacci Channel System: Between the upper and lower bounds, the script automatically calculates and displays up to 9 Fibonacci retracement levels (90.98%, 85.41%, 76.39%, 61.8%, 50%, 38.2%, 23.61%, 14.59%, and 9.02%).
Unique Features
=============================================
Dual Timeframe Options: Choose between two calibrated start dates (January 1985 or June 1998) with optimised parameters for each period.
Fully Adjustable Parameters: Fine-tune the intercept and slope values for both upper and lower curves to match your analysis needs.
Future Projections: Option to display curve extensions into the future, automatically adjusted based on your chart timeframe.
Visual Customisation: Three colour schemes (Light, Dark, and Rainbow) for different chart backgrounds and visual preferences.
Adaptive Display: Future projections automatically adjust their length based on your selected timeframe (monthly, weekly, daily, or hourly).
How to use this indicator
=============================================
Select Your Preferred Start Date: Choose between Jan 1985 or June 1998 based on which historical reference point you prefer for analysis.
Customise Visual Settings: Toggle Fibonacci levels and future projections on/off, and select your preferred colour scheme for your chart.
Interpret Price Position: Use the position of current prices relative to the curves to assess whether the Nasdaq 100 is in potential overvalued (upper curve), undervalued (lower curve), or fair value (middle) regions.
Identify Support/Resistance: The various Fibonacci levels serve as potential support and resistance zones based on the overall channel range.
Project Future Price Ranges: Enable curve projections to visualise potential future growth paths and price ranges for long-term analysis.
Unlike generic logarithmic regression tools, this indicator has been specifically calibrated for the Nasdaq 100's historical behaviour, with carefully optimised parameters that align with actual market cycles of this specific index.
Ww
Script protetto
Questo script è pubblicato come codice protetto. Tuttavia, è possibile utilizzarle liberamente e senza alcuna limitazione – ulteriori informazioni qui.
Declinazione di responsabilità
Le informazioni e le pubblicazioni non sono intese come, e non costituiscono, consulenza o raccomandazioni finanziarie, di investimento, di trading o di altro tipo fornite o approvate da TradingView. Per ulteriori informazioni, consultare i Termini di utilizzo.