OPEN-SOURCE SCRIPT
UCS_I_Martin Pring's Special K
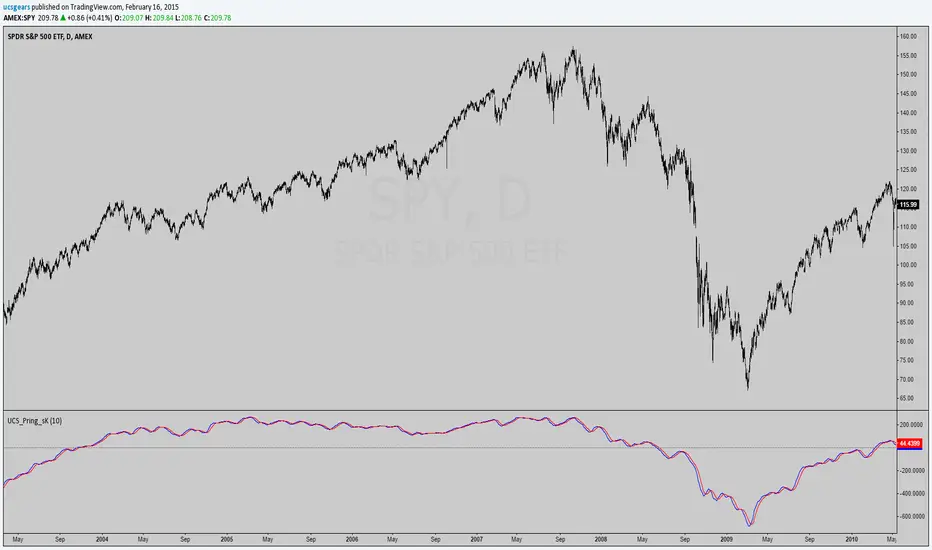
Pring's Special K is a cyclical indicator created by Martin Pring. His method combines short-term, intermediate and long-term velocity into one complete series. Useful tool for Long Term Investors
Function -
1) Primary Trend Reversals at a Relatively Early Stage.
2) Timing Short term Price Moves.
This indicator is always part of my analysis indicator set on stockcharts.com, Wanted to share it here.
Primary Use is to find TOPs and BOTTOMS in a Market - Not 100% but the most reliable warning sign when the market is TIRED.
Drawback - Need at least 725 Bars to calculate this - Originally Developed by Martin Pring.
MORE INFO --------------------->>>
stockcharts.com/school/doku.php?id=chart_school:technical_indicators:pring_s_special_k
My Personal Goal for this Indicator is to convert this into an Overlay, with All the components (Short/Mid/Long) meaningfully plotted out. This would make this indicator far more useful in predicting the future longer term trend.
Script open-source
In pieno spirito TradingView, il creatore di questo script lo ha reso open-source, in modo che i trader possano esaminarlo e verificarne la funzionalità. Complimenti all'autore! Sebbene sia possibile utilizzarlo gratuitamente, ricorda che la ripubblicazione del codice è soggetta al nostro Regolamento.
Uday C Santhakumar
Declinazione di responsabilità
Le informazioni ed i contenuti pubblicati non costituiscono in alcun modo una sollecitazione ad investire o ad operare nei mercati finanziari. Non sono inoltre fornite o supportate da TradingView. Maggiori dettagli nelle Condizioni d'uso.