PROTECTED SOURCE SCRIPT
Aggiornato Correlation Volitility Bars [BVCC]
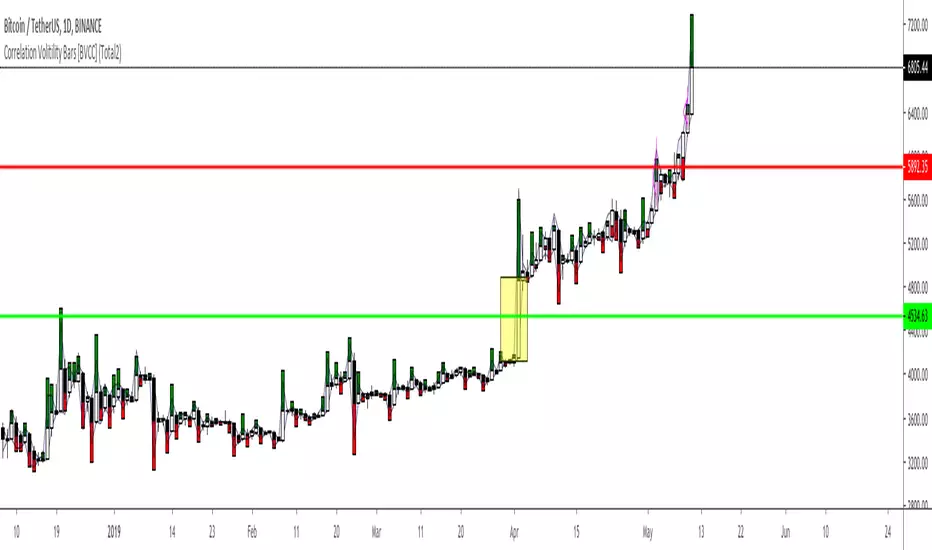
This chart will allow you to compare the volatility of correlation of any other instrument to your current chart. When the comparison coin is selected, it will overlay your current bars with additional information that shows up/down correlation to your master chart as well the volatility of that correlation.
This can be used to compare other coins to BTC for a quick visual reference of if a coin moves with or against BTC movements. If the comparison coin moves up on the given bar, it is represented by a green histogram ABOVE of your current candle. If the comparison coin moves down, it is represented as a red histogram BELOW your current candle.
The height of the correlation candle represents the percentage that the comparison coin moved up or down. The longer the candle, the farther that coin moved.
The blue band represents a 'volatility reference'
-If your comparison coin stays within this band, then it is moving at an absolute rate which is less than the absolute rate of the master coin.
-If your comparison coin moves outside of this band, then it is moving at an absolute rate which is more than the absolute rate of the master coin.
A couple of example of how to read this;
*******Master Candle = Up | Comparison Candle = Up | Equal to Volatility Band********
This means that when the master went up, so did the comparison coin and they both moved equal amounts
******Master Candle = Up | Comparison Candle = Down | Outside Volatility Band*******
This means that when the master went up, the comparison coin went down in response and it's downward response was greater than the corresponding master up movement
******Master Candle = Up | Comparison Candle = Up | Outside Volatility Band*******
This means that when the master went up, the comparison candle responded by going up as well but made more % gains than the corresponding master candle.
Uses for this indicator would be research into the historical performance of how a specific coin reacts to BTC and whether it is a more or less profitable vehicle than BTC during that time period. If the price is consistently outside of the Volatility band then you can infer that this coin is hypersensitive to BTC movements. If the price is consistently within the bands, then you could infer that your comparison coin is relatively correlated or unfazed by BTC.
Note di rilascio
Fixed a couple of calculation errors for a more accurate representation of relative % movement. Note di rilascio
removed some inputs that should not have been there. Note di rilascio
Changed default comparison model to Alt market cap. Script protetto
Questo script è pubblicato come codice protetto. Tuttavia, è possibile utilizzarlo liberamente e senza alcuna limitazione – per saperne di più clicca qui.
Declinazione di responsabilità
Le informazioni ed i contenuti pubblicati non costituiscono in alcun modo una sollecitazione ad investire o ad operare nei mercati finanziari. Non sono inoltre fornite o supportate da TradingView. Maggiori dettagli nelle Condizioni d'uso.
Script protetto
Questo script è pubblicato come codice protetto. Tuttavia, è possibile utilizzarlo liberamente e senza alcuna limitazione – per saperne di più clicca qui.
Declinazione di responsabilità
Le informazioni ed i contenuti pubblicati non costituiscono in alcun modo una sollecitazione ad investire o ad operare nei mercati finanziari. Non sono inoltre fornite o supportate da TradingView. Maggiori dettagli nelle Condizioni d'uso.