Critical Support & Resistance Level (supply & demand zone)
What is the difference between Support & Resistance Level and Supply & Demand Zone?
In my opinion, Support & Resistance Level is the value of price that tested couple times and hard to break. The zone is formed by two adjacent levels where price may oscillate between those two levels.
Imagine the levels as horizontal lines, and the zones are areas between two horizontal lines.
Why are they important?
In a nutshell, they indicate where the price direction may reverse so you can act accordingly.
There are a couple methods to draw the Support & Resistance Level and Supply & Demand Zone, In most case, people will use swing high or low, or pivot points as the level. But there are too many of them, and not all pivot points will become Support & Resistance Level.
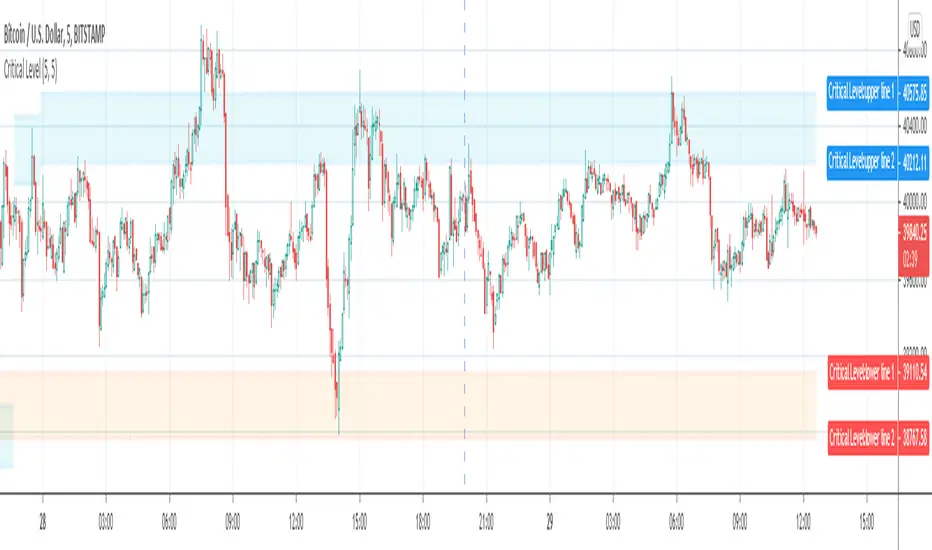
Some of the support or resistance level is hard to break, but after the price break through that level, resistance will become support and vice versa, I define it as Critical Level.
If you draw a critical support or resistance level from the current bar and move backward to where it started, you will notice that some levels are formed by the pivot points from hundreds of bars ago. It's impossible to discover the Critical Levels if you don't have enough bars loaded on chart.
The purpose of this indicator is to plot critical support and resistance level automatically on chart.
It will work on all market, Stock, Forex and Futures. It also works on all timeframes.
Inputs:
The Strength inputs control the intensity of Support & Resistance Level.
The Alert input is the switch of alert function.
By enable Enhanced mode, the indicator will be more critical.
Check Showline input to plot level lines on chart, otherwise, it will plot zones only.
Script su invito
Solo gli utenti approvati dall'autore possono accedere a questo script. È necessario richiedere e ottenere l'autorizzazione per utilizzarlo. Tale autorizzazione viene solitamente concessa dopo il pagamento. Per ulteriori dettagli, seguire le istruzioni dell'autore riportate di seguito o contattare direttamente Patternsmart.
TradingView NON consiglia di pagare o utilizzare uno script a meno che non ci si fidi pienamente del suo autore e non si comprenda il suo funzionamento. Puoi anche trovare alternative gratuite e open-source nei nostri script della comunità.
Istruzioni dell'autore
Attenzione: prima di richiedere l'accesso, leggi la nostra guida per gli script su invito.
Declinazione di responsabilità
Script su invito
Solo gli utenti approvati dall'autore possono accedere a questo script. È necessario richiedere e ottenere l'autorizzazione per utilizzarlo. Tale autorizzazione viene solitamente concessa dopo il pagamento. Per ulteriori dettagli, seguire le istruzioni dell'autore riportate di seguito o contattare direttamente Patternsmart.
TradingView NON consiglia di pagare o utilizzare uno script a meno che non ci si fidi pienamente del suo autore e non si comprenda il suo funzionamento. Puoi anche trovare alternative gratuite e open-source nei nostri script della comunità.
Istruzioni dell'autore
Attenzione: prima di richiedere l'accesso, leggi la nostra guida per gli script su invito.