OPEN-SOURCE SCRIPT
Aggiornato buy sell pressure
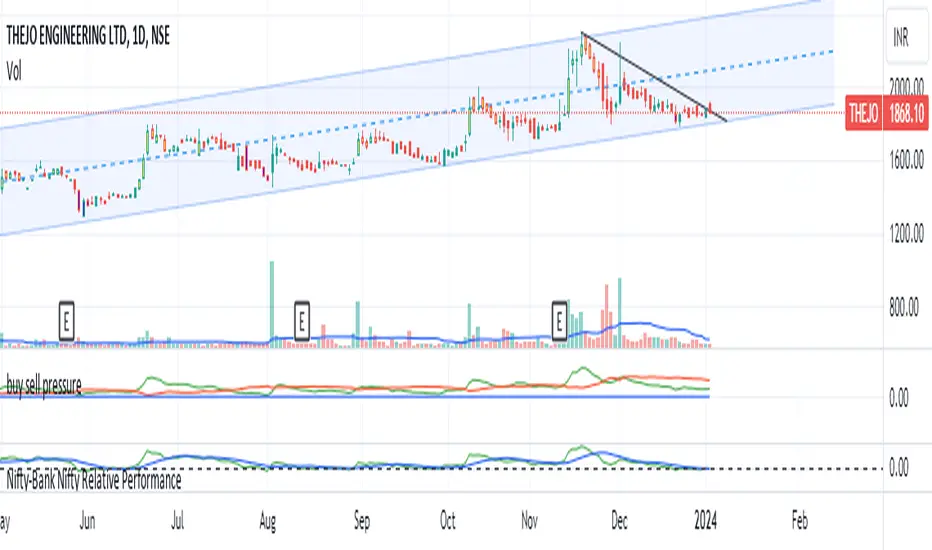
buy sell pressure indicator
Every stock /indices /chart is unique in nature. there will always be some kind of buyers and sellers present in these equities/stocks. due to their inherent buying and selling nature, these stocks also develop a pattern. such patterns are not always visible directly on the chart but we can calculate buying and selling pressure for these stocks individually . if we plot a graph on chart , we can easily see when stock is getting and when it is showing strength.
The logic for calculating buying and selling pressure is given below-
buying pressure= 14 days ema of {close- low(1)}
selling pressure= 14 days ema of {high(1)- close}
low (1) indicates 1 day ago candle's low price
high(1) indicates 1 day ago candle's high price
close= recent candle's close price
how to read chart :-
whenever buying pressure line (green color) crosses the selling pressure line (red color)stock will show strength and will go up. if the red line starts to cross the green line then we may see prices go down. so one can book profit here.
there is a unique zero line which is blue in color. it will act as a supreme buy and sell zone. if the green line touches or somehow goes below the zero line(blue line), stock will see strong buying pressure . if the red line (selling pressure line) goes below the zero line, the stock will witness strong selling pressure.
Note di rilascio
The provided source code is a script for a financial trading indicator written in Pine Script, a programming language used on the TradingView platform. Here's a summary of the code:
Buy-Sell Pressure Indicator:
The script is named "buy sell pressure," and it appears to focus on analyzing buying and selling pressure in the market.
Input Parameters:
The code defines several input parameters that allow users to customize the indicator's behavior, such as lengths for moving averages and RSI calculations.
Calculations:
Two variables, number1 and number2, are calculated based on the difference between close and low/high prices of the previous candle, respectively.
Exponential Moving Averages (EMAs) are calculated for these numbers with lengths specified by the user.
RSI (Relative Strength Index):
The RSI is calculated based on user-defined parameters, including the length of the RSI calculation.
The script determines whether the RSI is in an overbought or oversold condition. Overbought is set at an RSI value of 60, and oversold is set at an RSI value of 40.
The bar colors change accordingly, with yellow indicating overbought conditions and a specific shade of blue indicating oversold conditions.
Plotting:
The script plots the EMAs on the chart using the plot function, with different colors for visual representation.
Additionally, a horizontal line is plotted at the zero level using a blue color.
Summary:
The script combines information from moving averages and RSI to identify potential buying or selling opportunities. It also includes visual cues on the chart for overbought and oversold conditions. Traders may use this information to make informed decisions about market entry or exit points.
It's important to note that the effectiveness of the indicator depends on various factors, and users should thoroughly test and understand the strategy before using it for live trading.
Script open-source
In pieno spirito TradingView, il creatore di questo script lo ha reso open-source, in modo che i trader possano esaminarlo e verificarne la funzionalità. Complimenti all'autore! Sebbene sia possibile utilizzarlo gratuitamente, ricorda che la ripubblicazione del codice è soggetta al nostro Regolamento.
Declinazione di responsabilità
Le informazioni ed i contenuti pubblicati non costituiscono in alcun modo una sollecitazione ad investire o ad operare nei mercati finanziari. Non sono inoltre fornite o supportate da TradingView. Maggiori dettagli nelle Condizioni d'uso.