PROTECTED SOURCE SCRIPT
Crypto Volatility Panel Pro
Crypto Volatility Panel Pro
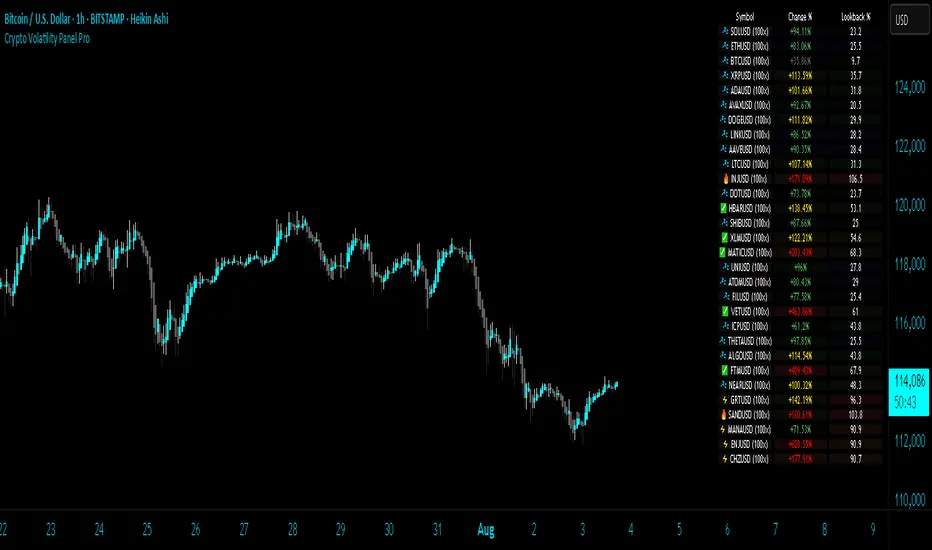
This advanced indicator creates a comprehensive volatility monitoring dashboard that displays real-time volatility metrics for up to 30 cryptocurrency pairs simultaneously. The tool combines sophisticated volatility assessment techniques with leverage-adjusted analysis and heat map visualization to provide enhanced market insights in an organized table format.
Proprietary Methodology
This indicator utilizes a proprietary dual-metric volatility assessment system developed specifically for cryptocurrency market analysis. The methodology combines advanced technical analysis components including price volatility measurements, range position analysis, and leverage scaling algorithms optimized through extensive market testing.
The unique approach enables more accurate volatility assessments across diverse cryptocurrency price ranges and market conditions compared to standard volatility indicators. Specific calculation methods and optimization parameters remain proprietary to maintain competitive advantages.
Core Functionality and Innovation
Unlike standard volatility indicators that focus on single instruments, this tool provides simultaneous multi-asset monitoring with proprietary volatility calculations specifically optimized for cryptocurrency markets. The innovation lies in combining multiple volatility assessment techniques with enhanced leverage scaling algorithms, heat map ranking system, and comprehensive multi-asset dashboard presentation.
The indicator processes data from up to 30 different cryptocurrency pairs, each with independent leverage settings ranging from 0.1x to 10,000x. Users can apply universal leverage across all pairs for consistent analysis scenarios, or customize individual leverage ratios for specific trading strategies.
Visual Organization and Heat Map System
The table displays three primary columns with an advanced heat map ranking system:
Symbol Column: Shows cryptocurrency pair names with dynamic visual indicators (🔥, ⚡, ✅, 💤) representing volatility intensity levels. Each symbol includes its current leverage setting in parentheses for reference. Invalid or unavailable symbols display error indicators (❌) with appropriate error messaging.
Change Percentage Column: Displays leverage-adjusted volatility measurements with both color-coded text and heat map background ranking. Text colors indicate volatility levels (Red for extreme, Yellow for high, Green for moderate, Gray for low), while background heat map colors rank performance relative to all monitored pairs.
Lookback Percentage Column: Shows leverage-adjusted position analysis within recent price ranges with heat map background ranking, indicating market positioning relative to recent highs and lows across all monitored instruments.
Advanced Heat Map Ranking
The proprietary heat map system ranks all enabled pairs in real-time based on their volatility metrics, providing instant visual identification of the most and least volatile instruments:
Hottest (Top 10%): Deep red background indicating highest volatility
Warm (10-20%): Orange-red background for elevated volatility
Medium (20-40%): Yellow background for moderate-high volatility
Cool (40-60%): Green background for moderate volatility
Cold (60-80%): Blue background for low volatility
Sleepy (Bottom 20%): Dark background for minimal volatility
Heat map opacity is fully customizable, and the system can be disabled for users preferring traditional static backgrounds.
Configuration Options
Expanded Pair Selection: Monitor up to 30 cryptocurrency pairs across major exchanges including Bitstamp and Binance. Default selections include established cryptocurrencies (BTC, ETH, SOL) and emerging assets (INJ, NEAR, FTM), with full customization available.
Table Positioning: Nine position options including top/middle/bottom combinations with left/center/right alignment, allowing optimal placement on any chart layout without interfering with price action or other indicators.
Visual Customization: Comprehensive control over table dimensions, frame width, font size, background colors, frame colors, header styling, text colors, and heat map color schemes to match user preferences and chart themes.
Leverage Management: Individual leverage settings for each of the 30 pairs, with optional universal leverage mode that applies consistent multipliers across all enabled pairs. Supports extreme leverage ranges up to 10,000x for advanced risk modelling.
Error Handling: Robust symbol validation with clear error indicators for invalid, unavailable, or misconfigured trading pairs, ensuring reliable operation across different market conditions.
Practical Trading Applications
Multi-Asset Volatility Screening: Identify the most and least volatile cryptocurrency markets in real-time using the heat map ranking system, enabling quick allocation of attention to instruments with the highest potential for profitable moves.
Leverage Risk Assessment: Visualize how different leverage ratios amplify volatility metrics across multiple markets simultaneously, supporting informed position sizing decisions before entering leveraged trades.
Market Timing and Rotation: Use the combination of volatility measurements and heat map rankings to identify optimal entry/exit timing across cryptocurrency markets, facilitating effective portfolio rotation strategies.
Portfolio Diversification: Compare volatility levels and rankings across 30 cryptocurrencies to construct portfolios with desired risk characteristics, balancing high-volatility growth opportunities with stable store-of-value positions.
Risk Management Dashboard: Monitor real-time volatility changes and relative rankings to adjust position sizes, implement protective measures, or reallocate capital when market conditions change significantly.
Technical Implementation
Built using Pine Script v5 with optimized security request handling to minimize performance impact while accessing 30 external data sources simultaneously. The indicator uses efficient array-based data collection, real-time ranking algorithms, and conditional table updates to maintain smooth chart operation.
The heat map system employs dynamic ranking calculations that process all enabled pairs in real-time, sorting values and applying percentile-based color mapping for instant visual feedback. Error handling includes invalid symbol detection and graceful fallback display for unavailable data feeds.
Usage Instructions
Configure Pair Selection: Enable desired cryptocurrency pairs from the 30 available options, organized across three input groups for easy navigation. Set individual leverage values or activate universal leverage mode for consistent multipliers.
Customize Heat Map: Adjust heat map colors and opacity to match your visual preferences and chart theme. The system can be disabled for users preferring static backgrounds.
Position and Style Table: Select optimal table position from nine available options and customize appearance including colors, sizing, and text elements to integrate seamlessly with your trading setup.
Interpret Rankings: Monitor both absolute values and heat map rankings to identify relative performance.
Hottest colors indicate pairs experiencing the highest volatility relative to the monitored universe.
Apply Leverage Context: Use leverage-adjusted values to understand how volatility would affect leveraged positions, remembering these are mathematical projections designed for risk assessment rather than trading signals.
Advanced Features
Dynamic Symbol Processing: The indicator automatically handles symbol validation, displaying clear error messages for invalid or unavailable trading pairs while maintaining operation for valid symbols.
Real-Time Ranking: Heat map colors update dynamically as market conditions change, providing instant visual feedback on shifting volatility patterns across the cryptocurrency universe.
Scalable Monitoring: Users can monitor anywhere from a few key pairs to the full 30-pair universe, with the ranking system automatically adjusting to the number of enabled instruments.
Cross-Exchange Support: Incorporates data from multiple cryptocurrency exchanges to provide comprehensive market coverage and reduce single-source dependency risks.
Limitations and Important Considerations
Proprietary Algorithm: The specific calculation methods are proprietary and not disclosed. Users should evaluate the indicator's output through their own analysis and testing before incorporating it into trading decisions.
Complex Volatility Model: While the proprietary methodology is sophisticated, it represents one approach to volatility assessment and may not capture all forms of market volatility such as gap movements, flash crashes, or news-driven events.
Performance Considerations: Processing data from up to 30 external securities may impact chart loading speed or cause timeouts during periods of high TradingView server load. Users experiencing performance issues should consider reducing the number of enabled pairs.
Leverage Calculations: Leverage adjustments are mathematical projections that assume linear scaling, which may not reflect actual leveraged trading mechanics including margin requirements, funding costs, liquidation risks, and exchange-specific policies.
Market Data Dependencies: Cryptocurrency prices and volatility can vary significantly between exchanges. The indicator's data sources may not represent the specific exchange or trading pair you use, and some feeds may experience gaps or delays during maintenance periods.
Ranking Relativity: Heat map rankings are relative to the enabled pair universe. Rankings will change based on which pairs are monitored and their current market conditions, making absolute interpretations less meaningful than relative comparisons.
Educational Value
This indicator helps traders develop understanding of relative volatility patterns across cryptocurrency markets and the mathematical impact of leverage on risk metrics. The heat map system provides intuitive visualization of market dynamics, helping users identify which assets are experiencing unusual activity relative to their peers.
The tool serves as an educational platform for understanding advanced volatility measurement techniques, relative ranking systems, and multi-asset risk assessment concepts that are crucial for professional cryptocurrency trading and portfolio management.
Performance and Compatibility
The indicator is optimized for cryptocurrency markets but can be adapted to other volatile asset classes by modifying the symbol inputs. Security request limits may occasionally affect data availability, particularly when multiple indicators requesting external data are used simultaneously on the same chart.
The heat map rendering system is designed for efficiency, updating color mappings only when ranking changes occur rather than on every price tick, ensuring smooth chart performance even when monitoring the full 30-pair universe.
Risk Disclaimer: This indicator is designed for educational and analytical purposes only. Volatility calculations are estimates based on historical price data and proprietary mathematical models that are not disclosed. Results do not constitute trading advice or predictions of future price movements. Users should conduct independent analysis to evaluate the indicator's effectiveness before making trading decisions.
Leveraged trading involves substantial risk of loss and may not be suitable for all investors. Always conduct thorough research and consider consulting with qualified financial professionals before making leveraged trading decisions. Cryptocurrency markets are highly volatile and can result in significant losses. Past volatility patterns do not guarantee future market behavior.
This indicator is compatible with all TradingView chart types and timeframes. It is specifically designed for cryptocurrency markets using proprietary algorithms optimized for digital asset volatility characteristics.
Script protetto
Questo script è pubblicato come codice protetto. Tuttavia, è possibile utilizzarle liberamente e senza alcuna limitazione – ulteriori informazioni qui.
Declinazione di responsabilità
Le informazioni e le pubblicazioni non sono intese come, e non costituiscono, consulenza o raccomandazioni finanziarie, di investimento, di trading o di altro tipo fornite o approvate da TradingView. Per ulteriori informazioni, consultare i Termini di utilizzo.