OPEN-SOURCE SCRIPT
Aggiornato Logistic EMA w/ Signals by DGT
Logistic Map Equation - The logistic map connects fluid convection, neuron firing, the Mandelbrot set and so much more.
This study is an attempt to apply Logistic Map Equation in Trading
Logistic Map Equation
Xn+1 = r * Xn * (1 - Xn)
Where,
r - growth rate
Xn - percentage of theoretical maximum of measured event (from 0 to 1)
(1 - Xn) - represents constraints of the environment, presents the idea of negative feedback
For trading the measured event will be the price of the instrument (price is commonly reffered as source in mathematicall forumlations),
hence
r - growth rate can be expressed as => change(source, length) / source, expressing r in such manner mades the equation dynamic with regards to the growth rate
Xn - percentage of theoretical maximum of the price for given duration can be expressed as => source / highest(length)
Putting pieces together we are ready to plot

Printed alone does not seem to provide much useful visualization for trading, in fact not easy to interpret especially when the market is an uptrend
What it has numerically,
Provides a ratio, where sudden changes are much more reflected thanks to negative feedback nature of the logistic equation.
As we know moving average indicators are lagging and the logistic map may fit here to reduce the lag
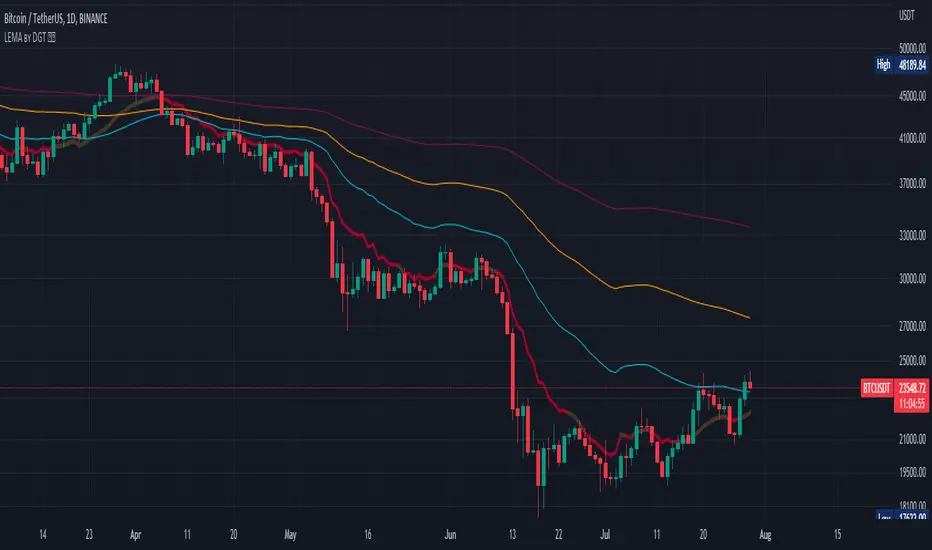
With this study you will find application of Logistic Map Equation with combination of Exponential Moving Average (EMA)
Logistic EMA (LEMA) and LEMA COLORS
one line with user defined periods of length, where the colors of the line will change automatically depending where the value is compared to 50-100-200 moving average

Multiple LEMAs : optional – three fixed lenght of 50-100-200 period lines

LEMA Signals
Various signals are added by using LEMA and applying some common market approaches. Use with caution and with conjunction of other indicators

Thanks to allanster for the idea
A fascinating YouTube video explaining the logistic map - “This equation will change how you see the world (the logistic map)”
Disclaimer:
Trading success is all about following your trading strategy and the indicators should fit within your trading strategy, and not to be traded upon solely
The script is for informational and educational purposes only. Use of the script does not constitute professional and/or financial advice. You alone have the sole responsibility of evaluating the script output and risks associated with the use of the script. In exchange for using the script, you agree not to hold dgtrd TradingView user liable for any possible claim for damages arising from any decision you make based on use of the script
This study is an attempt to apply Logistic Map Equation in Trading
Logistic Map Equation
Xn+1 = r * Xn * (1 - Xn)
Where,
r - growth rate
Xn - percentage of theoretical maximum of measured event (from 0 to 1)
(1 - Xn) - represents constraints of the environment, presents the idea of negative feedback
For trading the measured event will be the price of the instrument (price is commonly reffered as source in mathematicall forumlations),
hence
r - growth rate can be expressed as => change(source, length) / source, expressing r in such manner mades the equation dynamic with regards to the growth rate
Xn - percentage of theoretical maximum of the price for given duration can be expressed as => source / highest(length)
Putting pieces together we are ready to plot
Printed alone does not seem to provide much useful visualization for trading, in fact not easy to interpret especially when the market is an uptrend
What it has numerically,
Provides a ratio, where sudden changes are much more reflected thanks to negative feedback nature of the logistic equation.
As we know moving average indicators are lagging and the logistic map may fit here to reduce the lag
With this study you will find application of Logistic Map Equation with combination of Exponential Moving Average (EMA)
Logistic EMA (LEMA) and LEMA COLORS
one line with user defined periods of length, where the colors of the line will change automatically depending where the value is compared to 50-100-200 moving average
Multiple LEMAs : optional – three fixed lenght of 50-100-200 period lines
LEMA Signals
Various signals are added by using LEMA and applying some common market approaches. Use with caution and with conjunction of other indicators
Thanks to allanster for the idea
A fascinating YouTube video explaining the logistic map - “This equation will change how you see the world (the logistic map)”
Disclaimer:
Trading success is all about following your trading strategy and the indicators should fit within your trading strategy, and not to be traded upon solely
The script is for informational and educational purposes only. Use of the script does not constitute professional and/or financial advice. You alone have the sole responsibility of evaluating the script output and risks associated with the use of the script. In exchange for using the script, you agree not to hold dgtrd TradingView user liable for any possible claim for damages arising from any decision you make based on use of the script
Note di rilascio
minor fixNote di rilascio
enchamnent :- lema plotting now is made of two lines, the first one as explined above, the second line colors calculated based on high low values
- lema values optimized
- macd removed form probable trade singnals and instead trend dicrection calculated based on high low moving averages added
Note di rilascio
alert functionality added Script open-source
In pieno spirito TradingView, il creatore di questo script lo ha reso open-source, in modo che i trader possano esaminarlo e verificarne la funzionalità. Complimenti all'autore! Sebbene sia possibile utilizzarlo gratuitamente, ricorda che la ripubblicazione del codice è soggetta al nostro Regolamento.
Our Premium Indicators: sites.google.com/view/solemare-analytics
Declinazione di responsabilità
Le informazioni ed i contenuti pubblicati non costituiscono in alcun modo una sollecitazione ad investire o ad operare nei mercati finanziari. Non sono inoltre fornite o supportate da TradingView. Maggiori dettagli nelle Condizioni d'uso.
Script open-source
In pieno spirito TradingView, il creatore di questo script lo ha reso open-source, in modo che i trader possano esaminarlo e verificarne la funzionalità. Complimenti all'autore! Sebbene sia possibile utilizzarlo gratuitamente, ricorda che la ripubblicazione del codice è soggetta al nostro Regolamento.
Our Premium Indicators: sites.google.com/view/solemare-analytics
Declinazione di responsabilità
Le informazioni ed i contenuti pubblicati non costituiscono in alcun modo una sollecitazione ad investire o ad operare nei mercati finanziari. Non sono inoltre fornite o supportate da TradingView. Maggiori dettagli nelle Condizioni d'uso.