OPEN-SOURCE SCRIPT
CM_Hourly Pivots
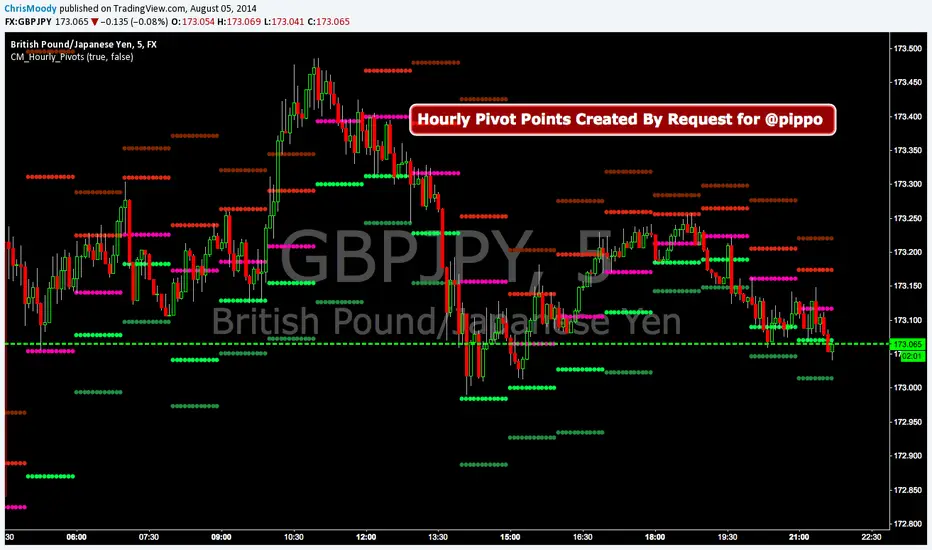
Simple Code for Hourly Pivot Points Requested by user pippo
Inputs Tab:
Turn On/Off Pivots
Turn On/Off R3/S3
Inputs Tab:
Turn On/Off Pivots
Turn On/Off R3/S3
Script open-source
In pieno spirito TradingView, il creatore di questo script lo ha reso open-source, in modo che i trader possano esaminarlo e verificarne la funzionalità. Complimenti all'autore! Sebbene sia possibile utilizzarlo gratuitamente, ricorda che la ripubblicazione del codice è soggetta al nostro Regolamento.
Coming Soon: ChrisMoodyTrading.com
Declinazione di responsabilità
Le informazioni ed i contenuti pubblicati non costituiscono in alcun modo una sollecitazione ad investire o ad operare nei mercati finanziari. Non sono inoltre fornite o supportate da TradingView. Maggiori dettagli nelle Condizioni d'uso.