OPEN-SOURCE SCRIPT
Aggiornato Fibonacci Trading
Fibonacci Trading
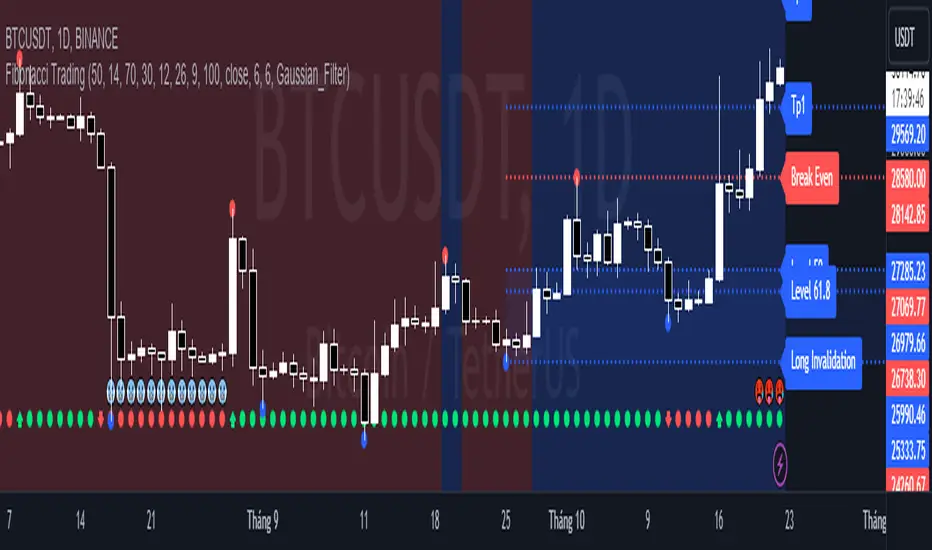
This simple script draw Fibonacci Retracement to define pullback level and draw Fibonacci Extension to define target level of a upward wave or doward wave
1. Upward wave
1.1 Fibonacci Retracement
+ Fibonacci Retracement measuare from support to nearest resistance on the right.
+ Retracement Level 0 named as "Breake Even"
+ Retracement Level 100 named as "Long Invalidation"
+ Retracement Level 50 and 61.8 is ploted as blue line
+ The zone between Retracement Level 50 and 100 is filled by blue color and named as "Buy zone"
1.2 Fibonacci Extension
+ Fibonacci Extension measuare from Retracement Level 61.8 to Retracement Level 0
+ Fibonacci Extension Level 161.8 named as "Tp1 (Target point 1)"
+ Fibonacci Extension Level 261.8 named as "Tp2 (Target point 2)"
2. Doward wave
2.1 Fibonacci Retracement
+ Fibonacci Retracement measuare from resistance to nearest support on the right.
+ Retracement Level 0 named as "Breake Even"
+ Retracement Level 100 named as "Short Invalidation"
+ Retracement Level 50 and 61.8 is ploted as red line
+ The zone between Retracement Level 50 and 100 is filled by red color and named as "Sell zone"
2.2 Fibonacci Extension
+ Fibonacci Extension measuare from Retracement Level 61.8 to Retracement Level 0
+ Fibonacci Extension Level 161.8 named as "Tp1 (Target point 1)"
+ Fibonacci Extension Level 261.8 named as "Tp2 (Target point 2)"
3. Trading Setup
3.1 Long Only: Only display Fibonacci of Upward wave
3.2 Short Only: Only display Fibonacci of Doward wave
3.3 Both: Display both Fibonacci of Upward wave and Doward wave
Note di rilascio
Update Feature MA Cycle in Trading Setup.3.4 MA Cycle: When EMA above SMA auto display Fibonacci of Upward wave, When EMA below SMA auto display Fibonacci of Downward wave.
Notes: When EMA above SMA, background is filled by blue. When EMA below SMA, background is filled by red. Uncheck "Fill background" to disable filling.
Note di rilascio
Update Feature RSI MACD in Trading Setup3.5 RSI MACD:
* When RSI cross down over sold level and then MACD create Buy Signal this script auto display Fibonacci of Upward wave
* When RSI cross up over bought level and then MACD create Sell Signal this script auto display Fibonacci of Downward wave
* Notes:
+ When MACD create Buy Signal after RSI oversold, background is filled by blue.
+ When MACD create Sell Signal after RSI overbought, background is filled by red.
+ Uncheck "RSI MACD Background Filling" to disable filling.
Note di rilascio
Update feature Gaussian Filter in Trading Setup3.6 Gaussian Filter:
* When price moving above Gaussian Filter, this script auto display Fibonacci of Upward wave.
* When price moving below Gaussian Filter, this script auto display Fibonacci of Downward wave.
* Notes:
+ When price moving above Gaussian Filter, background is filled by blue.
+ When price moving below Gaussian Filter, background is filled by red.
+ Uncheck Fill background to disable filling.
Script open-source
In pieno spirito TradingView, il creatore di questo script lo ha reso open-source, in modo che i trader possano esaminarlo e verificarne la funzionalità. Complimenti all'autore! Sebbene sia possibile utilizzarlo gratuitamente, ricorda che la ripubblicazione del codice è soggetta al nostro Regolamento.
Declinazione di responsabilità
Le informazioni ed i contenuti pubblicati non costituiscono in alcun modo una sollecitazione ad investire o ad operare nei mercati finanziari. Non sono inoltre fornite o supportate da TradingView. Maggiori dettagli nelle Condizioni d'uso.