OPEN-SOURCE SCRIPT
Aggiornato Modified Mannarino Market Risk Indicator & Bubbles
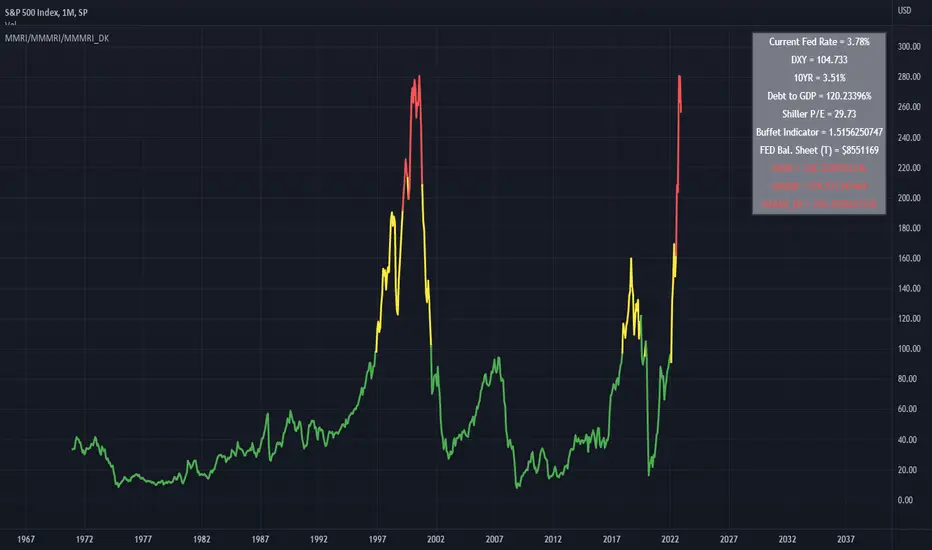
Modified Mannarino Market Risk Indicator
MMRI = DXY * 10Y Yield
MMMRI = MMRI * (Debt/GDP)
- Color Indicators
Green ~ Low Risk
Yellow - Mod Risk
Red - High Risk
Purple - Extreme Risk
*
Bubbles Formula (MMMRI_DK)
DXY*(10Y + FED Rate)* (Shiller P/E Ratio) * (Warren Buffet Indicator)*(Debt/GDP) /1.61
Similar to the Shiller P/E Ratio - you need to look back to see where the bubbles were. The difference between the Dot Com bubble and subsequent ones is that we now have QE which is why I included the FED Rate + 10Y.
*Color Indicators
Green ~ Low Risk
Yellow - Mod Risk
Red - High Risk
Purple - Extreme Risk
Future Bubbles Formula (MMMRI_DK_Fut)
DXY*(10Y + Future FED Rate)* (Shiller P/E Ratio) * (Warren Buffet Indicator)*(Debt/GDP) /1.61
Assumes that the 10Y is fixed but what is important is that you will get an idea on when the system may pop.
Note di rilascio
Bug FixScript open-source
Nello spirito di TradingView, l'autore di questo script lo ha reso open source, in modo che i trader possano esaminarne e verificarne la funzionalità. Complimenti all'autore! Sebbene sia possibile utilizzarlo gratuitamente, ricordiamo che la ripubblicazione del codice è soggetta al nostro Regolamento.
Declinazione di responsabilità
Le informazioni e le pubblicazioni non sono intese come, e non costituiscono, consulenza o raccomandazioni finanziarie, di investimento, di trading o di altro tipo fornite o approvate da TradingView. Per ulteriori informazioni, consultare i Termini di utilizzo.
Script open-source
Nello spirito di TradingView, l'autore di questo script lo ha reso open source, in modo che i trader possano esaminarne e verificarne la funzionalità. Complimenti all'autore! Sebbene sia possibile utilizzarlo gratuitamente, ricordiamo che la ripubblicazione del codice è soggetta al nostro Regolamento.
Declinazione di responsabilità
Le informazioni e le pubblicazioni non sono intese come, e non costituiscono, consulenza o raccomandazioni finanziarie, di investimento, di trading o di altro tipo fornite o approvate da TradingView. Per ulteriori informazioni, consultare i Termini di utilizzo.