PROTECTED SOURCE SCRIPT
Wyckoff PhaseMap Overlay [FxalgoxPro]
📊 Wyckoff PhaseMap Overlay [Fxalgox]
Professional Wyckoff Market Cycle Indicator for TradingView
━━━━━━━━━━━━━━━━━━━━━━━━━━━━━━━━━━━━━━━━
🎯 OVERVIEW
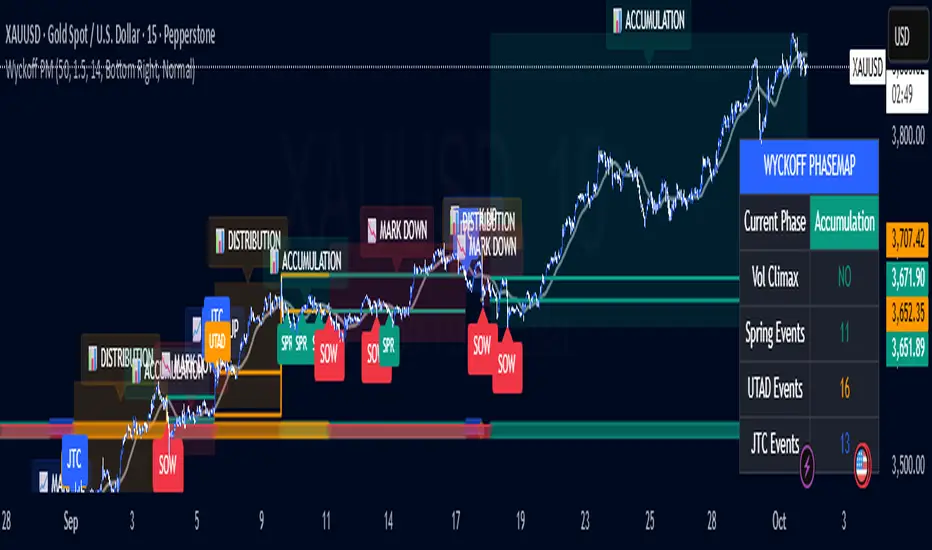
The Wyckoff PhaseMap Overlay is a sophisticated indicator that automatically identifies and visualizes the four phases of the Wyckoff Market Cycle on your price chart, combining price action analysis with volume confirmation to detect:
━━━━━━━━━━━━━━━━━━━━━━━━━━━━━━━━━━━━━━━━
🔑 KEY FEATURES
📈 Phase Detection
🎨 Visual Elements
📊 Dashboard
🔔 Alerts
━━━━━━━━━━━━━━━━━━━━━━━━━━━━━━━━━━━━━━━━
⚙️ CONFIGURATION
Wyckoff Phases (Main Settings)
Phase 1: Accumulation
Phase 2: Mark Up
Phase 3: Distribution
Phase 4: Mark Down
Visual Settings
Dashboard
━━━━━━━━━━━━━━━━━━━━━━━━━━━━━━━━━━━━━━━━
🧠 HOW IT WORKS
Phase Detection Logic
1️⃣ Accumulation (Cause)
2️⃣ Mark Up (Effect)
3️⃣ Distribution (Cause)
4️⃣ Mark Down (Effect)
━━━━━━━━━━━━━━━━━━━━━━━━━━━━━━━━━━━━━━━━
📝 EVENT DEFINITIONS
━━━━━━━━━━━━━━━━━━━━━━━━━━━━━━━━━━━━━━━━
🎯 USE CASES
For Traders
For Analysts
━━━━━━━━━━━━━━━━━━━━━━━━━━━━━━━━━━━━━━━━
🎨 RECOMMENDED SETTINGS
For Swing Trading (Daily/4H)
For Intraday Trading (1H/15m)
For Long-term Investors (Weekly)
━━━━━━━━━━━━━━━━━━━━━━━━━━━━━━━━━━━━━━━━
📚 WYCKOFF METHOD RESOURCES
The indicator is based on Richard Wyckoff's market cycle theory:
Learn More:
━━━━━━━━━━━━━━━━━━━━━━━━━━━━━━━━━━━━━━━━
⚠️ IMPORTANT NOTES
━━━━━━━━━━━━━━━━━━━━━━━━━━━━━━━━━━━━━━━━
🐛 TROUBLESHOOTING
Q: Why aren't any phases showing?
Q: Too many false signals?
Q: Dashboard not showing?
━━━━━━━━━━━━━━━━━━━━━━━━━━━━━━━━━━━━━━━━
👨💻 CREDITS
Developer: Fxalgox
Method: Richard Wyckoff Market Cycle Theory
━━━━━━━━━━━━━━━━━━━━━━━━━━━━━━━━━━━━━━━━
💡 TIPS FOR BEST RESULTS
━━━━━━━━━━━━━━━━━━━━━━━━━━━━━━━━━━━━━━━━
Happy Trading! 📈
Remember: This indicator is a tool for analysis, not financial advice. Always manage risk appropriately.
Professional Wyckoff Market Cycle Indicator for TradingView
━━━━━━━━━━━━━━━━━━━━━━━━━━━━━━━━━━━━━━━━
🎯 OVERVIEW
The Wyckoff PhaseMap Overlay is a sophisticated indicator that automatically identifies and visualizes the four phases of the Wyckoff Market Cycle on your price chart, combining price action analysis with volume confirmation to detect:
- Phase 1: Accumulation (Cause)
- Phase 2: Mark Up (Effect)
- Phase 3: Distribution (Cause)
- Phase 4: Mark Down (Effect)
━━━━━━━━━━━━━━━━━━━━━━━━━━━━━━━━━━━━━━━━
🔑 KEY FEATURES
📈 Phase Detection
- Accumulation: Identifies selling climax (SC), automatic rally (AR), secondary tests (ST), and springs
- Mark Up: Detects sustained uptrend with higher highs/higher lows structure
- Distribution: Recognizes buying climax (BC), UTAD (upthrust after distribution), and range formation
- Mark Down: Confirms breakdown with volume and downtrend structure
🎨 Visual Elements
- Phase Background Colors: Optional color-coded backgrounds for each phase
- Range Lines: Dynamic support/resistance levels during accumulation and distribution
- Event Markers: Clear labels for Spring, UTAD, JTC (Jump the Creek), and breakdowns
- Trend MA Overlay: Moving average for trend confirmation
- Phase Labels: Large, descriptive labels when phases change
📊 Dashboard
- Real-time phase status
- Volume climax indicator
- Event counters (Spring, UTAD, JTC)
- Customizable position and size
🔔 Alerts
- Phase change notifications
- Spring detection
- UTAD detection
- Jump the Creek confirmation
- Breakdown signals
━━━━━━━━━━━━━━━━━━━━━━━━━━━━━━━━━━━━━━━━
⚙️ CONFIGURATION
Wyckoff Phases (Main Settings)
Parameter | Default | Description
---------------------------- | ------- | -------------
Trend MA Length | 50 | Moving average for trend detection
Volume Climax Threshold | 1.5 | Multiplier for average volume to detect climax events
Range Detection Length | 14 | Lookback period for range identification
Phase 1: Accumulation
- Toggle accumulation phase display
- Show/hide Spring events
- Show/hide AR (Automatic Rally) and ST (Secondary Test)
- Customize phase and spring colors
Phase 2: Mark Up
- Toggle mark up phase display
- Show/hide Jump The Creek (JTC) events
- Customize phase and JTC colors
Phase 3: Distribution
- Toggle distribution phase display
- Show/hide UTAD events
- Show/hide BC (Buying Climax)
- Customize phase and UTAD colors
Phase 4: Mark Down
- Toggle mark down phase display
- Customize phase and breakdown colors
Visual Settings
- Show Phase Labels: Display large phase transition labels
- Show Event Markers: Display Spring, UTAD, JTC markers
- Show Phase Background: Color-code background by current phase
Dashboard
- Show Dashboard: Toggle statistics panel
- Position: Top Right / Bottom Right / Bottom Left
- Size: Tiny / Small / Normal
━━━━━━━━━━━━━━━━━━━━━━━━━━━━━━━━━━━━━━━━
🧠 HOW IT WORKS
Phase Detection Logic
1️⃣ Accumulation (Cause)
Triggers:
- Selling climax detected (high volume + down move)
- Price enters range-bound consolidation
- Low volume compression
- Spring: False breakdown below support with low volume
2️⃣ Mark Up (Effect)
Triggers:
- Jump The Creek (JTC): Breakout from accumulation range
- Volume confirms breakout (>1.3x average)
- Higher highs and higher lows structure
- Price above trend MA
3️⃣ Distribution (Cause)
Triggers:
- Buying climax detected (high volume + up move)
- Price enters range-bound consolidation after uptrend
- UTAD: False breakout above resistance with volume
- Range compression
4️⃣ Mark Down (Effect)
Triggers:
- Breakdown from distribution range
- Volume confirms breakdown (>1.3x average)
- Lower lows and lower highs structure
- Price below trend MA
━━━━━━━━━━━━━━━━━━━━━━━━━━━━━━━━━━━━━━━━
📝 EVENT DEFINITIONS
Event | Phase | Description | Visual
-------- | ------------- | ------------------------------------------------ | -------------------------
SC | Accumulation | Selling Climax - panic selling with high volume | Volume spike + price drop
AR | Accumulation | Automatic Rally - bounce from oversold | Recovery move
ST | Accumulation | Secondary Test - retest of lows | Low volume test
Spring | Accumulation | False breakdown below support | 🟢 Label below
JTC | Mark Up | Jump The Creek - confirmed breakout | 🔵 Label (transition)
BC | Distribution | Buying Climax - euphoric buying with high volume | Volume spike + price rise
UTAD | Distribution | Upthrust After Distribution - false breakout | 🟠 Label above
SOW | Mark Down | Sign of Weakness - confirmed breakdown | 🔴 Label (transition)
━━━━━━━━━━━━━━━━━━━━━━━━━━━━━━━━━━━━━━━━
🎯 USE CASES
For Traders
- Identify accumulation zones for potential long entries
- Recognize distribution zones for potential short entries or exits
- Confirm trend changes with phase transitions
- Avoid false breakouts (Springs and UTADs)
- Time entries using Jump The Creek signals
For Analysts
- Market structure analysis across multiple timeframes
- Volume-price divergence identification
- Institutional behavior tracking (accumulation/distribution)
- Cycle completion analysis
━━━━━━━━━━━━━━━━━━━━━━━━━━━━━━━━━━━━━━━━
🎨 RECOMMENDED SETTINGS
For Swing Trading (Daily/4H)
Trend MA Length: 50
Volume Climax Threshold: 1.5
Range Detection Length: 14
For Intraday Trading (1H/15m)
Trend MA Length: 20
Volume Climax Threshold: 2.0
Range Detection Length: 10
For Long-term Investors (Weekly)
Trend MA Length: 100
Volume Climax Threshold: 1.3
Range Detection Length: 20
━━━━━━━━━━━━━━━━━━━━━━━━━━━━━━━━━━━━━━━━
📚 WYCKOFF METHOD RESOURCES
The indicator is based on Richard Wyckoff's market cycle theory:
- Accumulation → Smart money accumulates while retail panics
- Mark Up → Price rises as smart money distributes to late buyers
- Distribution → Smart money exits while retail buys
- Mark Down → Price falls as retail holds losing positions
Learn More:
- Wyckoff Analytics
- Market cycle analysis
- Volume Spread Analysis (VSA)
━━━━━━━━━━━━━━━━━━━━━━━━━━━━━━━━━━━━━━━━
⚠️ IMPORTANT NOTES
- Volume Required: Indicator requires volume data (won't work on some Forex brokers without volume)
- Timeframe: Best results on 1H, 4H, Daily, Weekly
- Confirmation: Always combine with other analysis methods
- Context: Phase detection improves with clean, trending markets
━━━━━━━━━━━━━━━━━━━━━━━━━━━━━━━━━━━━━━━━
🐛 TROUBLESHOOTING
Q: Why aren't any phases showing?
- Ensure volume data is available for your symbol
- Try adjusting Volume Climax Threshold (lower = more sensitive)
- Check if Show Phase Background is enabled
Q: Too many false signals?
- Increase Volume Climax Threshold for stricter detection
- Increase Range Detection Length for better range identification
- Use higher timeframes (4H/Daily)
Q: Dashboard not showing?
- Check Show Dashboard is enabled in settings
- Ensure panel isn't off-screen (try different position)
━━━━━━━━━━━━━━━━━━━━━━━━━━━━━━━━━━━━━━━━
👨💻 CREDITS
Developer: Fxalgox
Method: Richard Wyckoff Market Cycle Theory
━━━━━━━━━━━━━━━━━━━━━━━━━━━━━━━━━━━━━━━━
💡 TIPS FOR BEST RESULTS
- Combine with Market Context: Use alongside market structure analysis
- Multi-timeframe Confirmation: Check higher timeframe phase alignment
- Volume is Key: Pay attention to volume climax indicators in dashboard
- Be Patient: Wait for phase confirmations before taking action
- Use Alerts: Set up alerts for phase changes and key events
━━━━━━━━━━━━━━━━━━━━━━━━━━━━━━━━━━━━━━━━
Happy Trading! 📈
Remember: This indicator is a tool for analysis, not financial advice. Always manage risk appropriately.
Script protetto
Questo script è pubblicato come codice protetto. Tuttavia, è possibile utilizzarle liberamente e senza alcuna limitazione – ulteriori informazioni qui.
Declinazione di responsabilità
Le informazioni e le pubblicazioni non sono intese come, e non costituiscono, consulenza o raccomandazioni finanziarie, di investimento, di trading o di altro tipo fornite o approvate da TradingView. Per ulteriori informazioni, consultare i Termini di utilizzo.