OPEN-SOURCE SCRIPT
Auto Darvas Boxes
## AUTO DARVAS BOXES
---
### OVERVIEW
**Auto Darvas Boxes** is a fully-automated, event-driven implementation of Nicolas Darvas’s 1950s box methodology.
The script tracks consolidation zones in real time, verifies that price truly “respects” those zones for a fixed validation window, then waits for the first decisive range violation to mark a directional breakout.
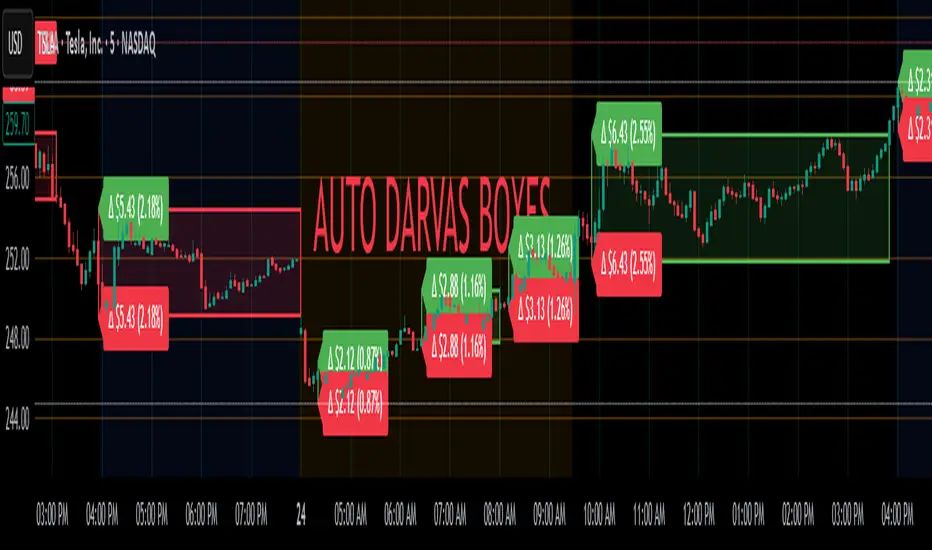
Every box is plotted end-to-end—from the first candle of the sideways range to the exact candle that ruptures it—giving you an on-chart, visually precise record of accumulation or distribution and the expansion that follows.
---
### HISTORICAL BACKGROUND
* Nicolas Darvas was a professional ballroom dancer who traded U.S. equities by telegram while touring the world.
* Without live news or Level II, he relied exclusively on **price** to infer institutional intent.
* His core insight: true market-moving entities leave footprints in the form of tight ranges; once their buying (or selling) is complete, price erupts out of the “box.”
* Darvas’s original procedure was manual—he kept notebooks, drew rectangles around highs and lows, and entered only when price punched out of the roof of a valid box.
* This indicator distills that logic into a rolling, self-resetting state machine so you never miss a box or breakout on any timeframe.
---
### ALGORITHM DETAIL (FOUR-STATE MACHINE)
**STATE 0 – RANGE DEFINITION**
• Examine the last *N* candles (default 7).
• Record `rangeHigh = highest(high, N) + tolerance`.
• Record `rangeLow = lowest(low, N) – tolerance`.
• Remember the index of the earliest bar in this window (`startBar`).
• Immediately transition to STATE 1.
**STATE 1 – RANGE VALIDATION**
• Observe the next *N* candles (again default 7).
• If **any** candle prints `high > rangeHigh` or `low < rangeLow`, the validation fails and the engine resets to STATE 0 **beginning at the violating candle**—no halfway boxes, no overlap.
• If all *N* candles remain inside the range, the box becomes **armed** and we transition to STATE 2.
**STATE 2 – ARMED (LIVE VISUAL FEEDBACK)**
• Draw a **green horizontal line** at `rangeHigh`.
• Draw a **red horizontal line** at `rangeLow`.
• Lines are extended in real time so the user can see the “live” Darvas ceiling and floor.
• Engine waits indefinitely for a breakout candle:
– **Up-Breakout** if `high > rangeHigh`.
– **Down-Breakout** if `low < rangeLow`.
**STATE 3 – BREAKOUT & COOLDOWN**
• Upon breakout the script:
1. Deletes the live range lines.
2. Draws a **filled rectangle (box)** from `startBar` to the breakout bar.
◦ **Green fill** when price exits above the ceiling.
◦ **Red fill** when price exits below the floor.
3. Optionally prints two labels at the left edge of the box:
◦ Dollar distance = `rangeHigh − rangeLow`.
◦ Percentage distance = `(rangeHigh − rangeLow) / rangeLow × 100 %`.
• After painting, the script waits a **user-defined cooldown** (default = 7 bars) before reverting to STATE 0. The cooldown guarantees separation between consecutive tests and prevents overlapping rectangles.
---
### INPUT PARAMETERS (ALL ADJUSTABLE FROM THE SETTINGS PANEL)
* **BARS TO DEFINE RANGE** – Number of candles used for both the definition and validation windows. Classic Darvas logic uses 7 but feel free to raise it on higher timeframes or volatile instruments.
* **OPTIONAL TOLERANCE** – Absolute price buffer added above the ceiling and below the floor. Use a small tolerance to ignore single-tick spikes or data-feed noise.
* **COOLDOWN BARS AFTER BREAKOUT** – How long the engine pauses before hunting for the next consolidation. Setting this equal to the range length produces non-overlapping, evenly spaced boxes.
* **SHOW BOX DISTANCE LABELS** – Toggle on/off. When on, each completed box displays its vertical size in both dollars and percentage, anchored at the box’s left edge.
---
### REAL-TIME VISUALISATION
* During the **armed** phase you see two extended, colour-coded guide-lines showing the exact high/low that must hold.
* When the breakout finally occurs, those lines vanish and the rectangle instantly appears, coloured to match the breakout direction.
* This immediate visual feedback turns any chart into a live Darvas tape—no manual drawing, no lag.
---
### PRACTICAL USE-CASES & BEST-PRACTICE WORKFLOWS
* **INTRADAY MOMENTUM** – Drop the script on 1- to 15-minute charts to catch tight coils before they explode. The coloured box marks the precise origin of the expansion; stops can sit just inside the opposite side of the box.
* **SWING & POSITION TRADING** – On 4-hour or daily charts, boxes often correspond to accumulation bases or volatility squeezes. Waiting for the box-validated breakout filters many false signals.
* **MEAN-REVERSION OR “FADE” STRATEGIES** – If a breakout immediately fails and price re-enters the box, you may have trapped momentum traders; fading that failure can be lucrative.
* **RISK MANAGEMENT** – Box extremes provide objective, structure-based stop levels rather than arbitrary ATR multiples.
* **BACK-TEST RESEARCH** – Because each box is plotted from first range candle to breakout candle, you can programmatically measure hold time, range height, and post-breakout expectancy for any asset.
---
### CUSTOMISATION IDEAS FOR POWER USERS
* **VOLATILITY-ADAPTIVE WINDOW** – Replace the fixed 7-bar length with a dynamic value tied to ATR percentile so the consolidation window stretches or compresses with volatility.
* **MULTI-TIMEFRAME LOGIC** – Only arm a 5-minute box if the 1-hour trend is aligned.
* **STRATEGY WRAPPER** – Convert the indicator to a full `strategy{}` script, automate entries on breakouts, and benchmark performance across assets.
* **ALERTS** – Create TradingView alerts on both up-breakout and down-breakout conditions; route them to webhook for broker automation.
---
### FINAL THOUGHTS
**Auto Darvas Boxes** packages one of the market’s oldest yet still potent price-action frameworks into a modern, self-resetting indicator. Whether you trade equities, futures, crypto, or forex, the script highlights genuine contraction-expansion sequences—Darvas’s original “boxes”—with zero manual effort, letting you focus solely on execution and risk.
---
### OVERVIEW
**Auto Darvas Boxes** is a fully-automated, event-driven implementation of Nicolas Darvas’s 1950s box methodology.
The script tracks consolidation zones in real time, verifies that price truly “respects” those zones for a fixed validation window, then waits for the first decisive range violation to mark a directional breakout.
Every box is plotted end-to-end—from the first candle of the sideways range to the exact candle that ruptures it—giving you an on-chart, visually precise record of accumulation or distribution and the expansion that follows.
---
### HISTORICAL BACKGROUND
* Nicolas Darvas was a professional ballroom dancer who traded U.S. equities by telegram while touring the world.
* Without live news or Level II, he relied exclusively on **price** to infer institutional intent.
* His core insight: true market-moving entities leave footprints in the form of tight ranges; once their buying (or selling) is complete, price erupts out of the “box.”
* Darvas’s original procedure was manual—he kept notebooks, drew rectangles around highs and lows, and entered only when price punched out of the roof of a valid box.
* This indicator distills that logic into a rolling, self-resetting state machine so you never miss a box or breakout on any timeframe.
---
### ALGORITHM DETAIL (FOUR-STATE MACHINE)
**STATE 0 – RANGE DEFINITION**
• Examine the last *N* candles (default 7).
• Record `rangeHigh = highest(high, N) + tolerance`.
• Record `rangeLow = lowest(low, N) – tolerance`.
• Remember the index of the earliest bar in this window (`startBar`).
• Immediately transition to STATE 1.
**STATE 1 – RANGE VALIDATION**
• Observe the next *N* candles (again default 7).
• If **any** candle prints `high > rangeHigh` or `low < rangeLow`, the validation fails and the engine resets to STATE 0 **beginning at the violating candle**—no halfway boxes, no overlap.
• If all *N* candles remain inside the range, the box becomes **armed** and we transition to STATE 2.
**STATE 2 – ARMED (LIVE VISUAL FEEDBACK)**
• Draw a **green horizontal line** at `rangeHigh`.
• Draw a **red horizontal line** at `rangeLow`.
• Lines are extended in real time so the user can see the “live” Darvas ceiling and floor.
• Engine waits indefinitely for a breakout candle:
– **Up-Breakout** if `high > rangeHigh`.
– **Down-Breakout** if `low < rangeLow`.
**STATE 3 – BREAKOUT & COOLDOWN**
• Upon breakout the script:
1. Deletes the live range lines.
2. Draws a **filled rectangle (box)** from `startBar` to the breakout bar.
◦ **Green fill** when price exits above the ceiling.
◦ **Red fill** when price exits below the floor.
3. Optionally prints two labels at the left edge of the box:
◦ Dollar distance = `rangeHigh − rangeLow`.
◦ Percentage distance = `(rangeHigh − rangeLow) / rangeLow × 100 %`.
• After painting, the script waits a **user-defined cooldown** (default = 7 bars) before reverting to STATE 0. The cooldown guarantees separation between consecutive tests and prevents overlapping rectangles.
---
### INPUT PARAMETERS (ALL ADJUSTABLE FROM THE SETTINGS PANEL)
* **BARS TO DEFINE RANGE** – Number of candles used for both the definition and validation windows. Classic Darvas logic uses 7 but feel free to raise it on higher timeframes or volatile instruments.
* **OPTIONAL TOLERANCE** – Absolute price buffer added above the ceiling and below the floor. Use a small tolerance to ignore single-tick spikes or data-feed noise.
* **COOLDOWN BARS AFTER BREAKOUT** – How long the engine pauses before hunting for the next consolidation. Setting this equal to the range length produces non-overlapping, evenly spaced boxes.
* **SHOW BOX DISTANCE LABELS** – Toggle on/off. When on, each completed box displays its vertical size in both dollars and percentage, anchored at the box’s left edge.
---
### REAL-TIME VISUALISATION
* During the **armed** phase you see two extended, colour-coded guide-lines showing the exact high/low that must hold.
* When the breakout finally occurs, those lines vanish and the rectangle instantly appears, coloured to match the breakout direction.
* This immediate visual feedback turns any chart into a live Darvas tape—no manual drawing, no lag.
---
### PRACTICAL USE-CASES & BEST-PRACTICE WORKFLOWS
* **INTRADAY MOMENTUM** – Drop the script on 1- to 15-minute charts to catch tight coils before they explode. The coloured box marks the precise origin of the expansion; stops can sit just inside the opposite side of the box.
* **SWING & POSITION TRADING** – On 4-hour or daily charts, boxes often correspond to accumulation bases or volatility squeezes. Waiting for the box-validated breakout filters many false signals.
* **MEAN-REVERSION OR “FADE” STRATEGIES** – If a breakout immediately fails and price re-enters the box, you may have trapped momentum traders; fading that failure can be lucrative.
* **RISK MANAGEMENT** – Box extremes provide objective, structure-based stop levels rather than arbitrary ATR multiples.
* **BACK-TEST RESEARCH** – Because each box is plotted from first range candle to breakout candle, you can programmatically measure hold time, range height, and post-breakout expectancy for any asset.
---
### CUSTOMISATION IDEAS FOR POWER USERS
* **VOLATILITY-ADAPTIVE WINDOW** – Replace the fixed 7-bar length with a dynamic value tied to ATR percentile so the consolidation window stretches or compresses with volatility.
* **MULTI-TIMEFRAME LOGIC** – Only arm a 5-minute box if the 1-hour trend is aligned.
* **STRATEGY WRAPPER** – Convert the indicator to a full `strategy{}` script, automate entries on breakouts, and benchmark performance across assets.
* **ALERTS** – Create TradingView alerts on both up-breakout and down-breakout conditions; route them to webhook for broker automation.
---
### FINAL THOUGHTS
**Auto Darvas Boxes** packages one of the market’s oldest yet still potent price-action frameworks into a modern, self-resetting indicator. Whether you trade equities, futures, crypto, or forex, the script highlights genuine contraction-expansion sequences—Darvas’s original “boxes”—with zero manual effort, letting you focus solely on execution and risk.
Script open-source
Nello spirito di TradingView, l'autore di questo script lo ha reso open source, in modo che i trader possano esaminarne e verificarne la funzionalità. Complimenti all'autore! Sebbene sia possibile utilizzarlo gratuitamente, ricordiamo che la ripubblicazione del codice è soggetta al nostro Regolamento.
Declinazione di responsabilità
Le informazioni e le pubblicazioni non sono intese come, e non costituiscono, consulenza o raccomandazioni finanziarie, di investimento, di trading o di altro tipo fornite o approvate da TradingView. Per ulteriori informazioni, consultare i Termini di utilizzo.