OPEN-SOURCE SCRIPT
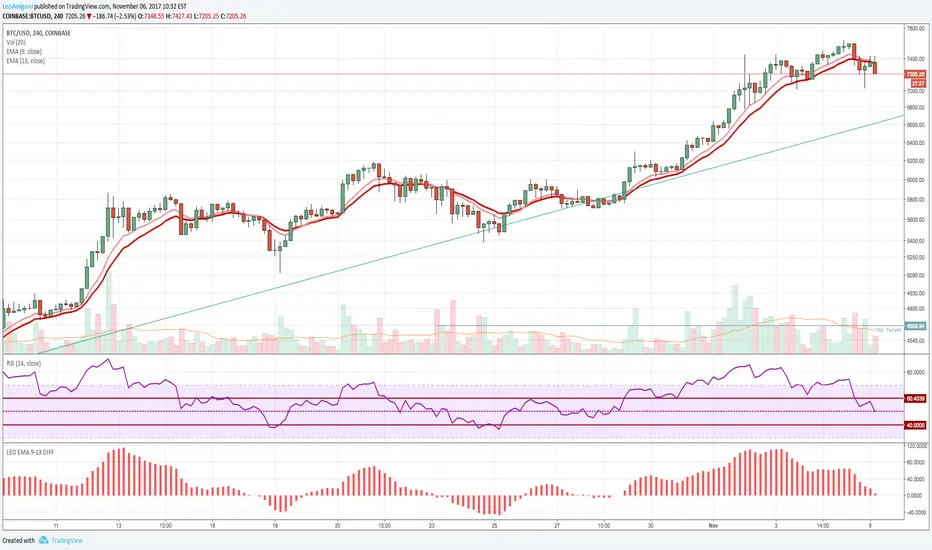
LEO EMA 9-13 DIFF
I made a public version of the private one that I made since I had so many requests.
Good indicator for buy and sell signals, better for buys usually works well on any timeframes. I use it on the 15m, 1hr, 4hr mostly.
You can plot the EMA's also on the chart to see the lines crossing but this indicator gives you a much easier read. It's very simple and basic all I do is plot the difference between the EMA 9 and the EMA 13. These values seem to give a very clear signal for entries and exits.
How to use.
- When the histogram becomes positive it's a buy signal when it becomes negative it's a sell signal.
- Note: Like any moving average this doesn't work well if you have a massive dip or a massive spike as the average will signal too late. but you should get some warning right before it happens.
Script open-source
In pieno spirito TradingView, il creatore di questo script lo ha reso open-source, in modo che i trader possano esaminarlo e verificarne la funzionalità. Complimenti all'autore! Sebbene sia possibile utilizzarlo gratuitamente, ricorda che la ripubblicazione del codice è soggetta al nostro Regolamento.
Declinazione di responsabilità
Le informazioni ed i contenuti pubblicati non costituiscono in alcun modo una sollecitazione ad investire o ad operare nei mercati finanziari. Non sono inoltre fornite o supportate da TradingView. Maggiori dettagli nelle Condizioni d'uso.