OPEN-SOURCE SCRIPT
Aggiornato GCM Centre Line Candle Marker
GCM Centre Line Candle Marker (GCM-CLCM) - Descriptive Notes
Indicator Overview:
The "GCM Centre Line Candle Marker" is a versatile TradingView overlay indicator designed to enhance chart analysis by drawing short horizontal lines at user-defined "centre" points of candles. These lines provide a quick visual reference to key price levels within each candle, such as midpoints, open, close, or typical prices. The indicator offers extensive customization for line appearance, positioning, and conditional display, including an option to highlight only bullish engulfing patterns.
Key Features:
1. Customizable Line Position:
o Users can choose from various methods to calculate the "centre" price for the line:
(High + Low) / 2 (Default)
(Open + Close) / 2
Close
Open
(Open + High + Low + Close) / 4 (HLCO/4)
(Open + High + Close) / 3 (Typical Price HLC/3 variation)
(Open + Close + Low) / 3 (Typical Price OCL/3 variation)
2. Line Appearance Customization:
o Visibility: Toggle lines on/off.
o Style: Solid, dotted, or dashed lines.
o Width: Adjustable line thickness (1 to 5).
o Length: Defines how many candles forward the line extends (1 to 10).
o Color: Lines are colored based on candle type (bullish/bearish), with user-selectable base colors.
o Dynamic Opacity: Line opacity is dynamically adjusted based on the candle's size relative to recent candles. Larger candles produce more opaque lines (up to the user-defined maximum opacity), while smaller candles result in more transparent lines. This helps significant candles stand out.
3. Price Labels:
o Show Labels: Option to display price labels at the end of each center line.
o Label Background Color: Customizable.
o Dynamic Text Color: Label text color can change based on the movement of the center price:
Green: Current center price is higher than the previous.
Red: Current center price is lower than the previous.
Gray: No change or first label.
o Static Text Color: Alternatively, a fixed color can be used for all labels.
4. Conditional Drawing - Bullish Engulfing Filter:
o Users can enable an option to Only Show Bullish Engulfing Candles. When active, center lines will only be drawn for candles that meet bullish engulfing criteria (current bull candle's body engulfs the previous bear candle's body).
5. Performance Management:
o Max Lines to Show: Limits the number of historical lines displayed on the chart to maintain clarity and performance. Older lines are automatically removed as new ones are drawn.
6. Alert Condition:
o Includes a built-in alert: Big Bullish Candle. This alert triggers when a bullish candle's range (high - low) is greater than the 20-period simple moving average (SMA) of candle ranges.
How It Works:
• For each new candle, the script calculates the "center" price based on the user's Line Position selection.
• If showLines is enabled and (if applicable) the bullish engulfing condition is met, a new line is drawn from the current candle's bar_index at the calculated _center price, extending lineLength candles forward.
• The line's color is determined by whether the candle is bullish (close > open) or bearish (close < open).
• Opacity is calculated dynamically: scaledOpacity = int((100 - maxUserOpacity) * (1 - dynamicFactor) + maxUserOpacity), where dynamicFactor is candleSize / maxSize (current candle size relative to the max size in the last 20 candles). This means maxUserOpacity is the least transparent the line will be (for the largest candles), and smaller candles will have lines approaching full transparency.
• Optional price labels are added at the end of these lines.
• The script manages an array of drawn lines, removing the oldest ones if the maxLines limit is exceeded.
Potential Use Cases:
• Visualizing Intra-Candle Levels: Quickly see midpoints or other key price points without manual drawing.
• Short-Term Reference Points: The extended lines can act as very short-term dynamic support/resistance or points of interest.
• Pattern Recognition: Highlight bullish engulfing patterns or simply emphasize candles based on their calculated center.
• Volatility Indication: The dynamic opacity can subtly indicate periods of larger or smaller candle ranges.
• Confirmation Tool: Use in conjunction with other indicators or trading strategies.
User Input Groups:
• Line Settings: Controls all aspects of the line's appearance and calculation.
• Label Settings: Manages the display and appearance of price labels.
• Other Settings: Contains options for line management and conditional filtering (like Bullish Engulfing).
This indicator provides a clean and customizable way to mark significant price levels within candles, aiding traders in their technical analysis.
Note di rilascio
GCM Centre Line Candle Marker (GCM-CLCM) - Descriptive NotesIndicator Overview:
The "GCM Centre Line Candle Marker" is a versatile TradingView overlay indicator designed to enhance chart analysis by drawing short horizontal lines at user-defined "centre" points of candles. These lines provide a quick visual reference to key price levels within each candle, such as midpoints, open, close, or typical prices. The indicator offers extensive customization for line appearance, positioning, and conditional display, including an option to highlight only bullish engulfing patterns.
Key Features:
1. Customizable Line Position:
o Users can choose from various methods to calculate the "centre" price for the line:
(High + Low) / 2 (Default)
(Open + Close) / 2
Close
Open
(Open + High + Low + Close) / 4 (HLCO/4)
(Open + High + Close) / 3 (Typical Price HLC/3 variation)
(Open + Close + Low) / 3 (Typical Price OCL/3 variation)
2. Line Appearance Customization:
o Visibility: Toggle lines on/off.
o Style: Solid, dotted, or dashed lines.
o Width: Adjustable line thickness (1 to 5).
o Length: Defines how many candles forward the line extends (1 to 10).
o Color: Lines are colored based on candle type (bullish/bearish), with user-selectable base colors.
o Dynamic Opacity: Line opacity is dynamically adjusted based on the candle's size relative to recent candles. Larger candles produce more opaque lines (up to the user-defined maximum opacity), while smaller candles result in more transparent lines. This helps significant candles stand out.
3. Price Labels:
o Show Labels: Option to display price labels at the end of each center line.
o Label Background Color: Customizable.
o Dynamic Text Color: Label text color can change based on the movement of the center price:
Green: Current center price is higher than the previous.
Red: Current center price is lower than the previous.
Gray: No change or first label.
o Static Text Color: Alternatively, a fixed color can be used for all labels.
4. Conditional Drawing - Bullish Engulfing Filter:
o Users can enable an option to Only Show Bullish Engulfing Candles. When active, center lines will only be drawn for candles that meet bullish engulfing criteria (current bull candle's body engulfs the previous bear candle's body).
5. Performance Management:
o Max Lines to Show: Limits the number of historical lines displayed on the chart to maintain clarity and performance. Older lines are automatically removed as new ones are drawn.
6. Alert Condition:
o Includes a built-in alert: Big Bullish Candle. This alert triggers when a bullish candle's range (high - low) is greater than the 20-period simple moving average (SMA) of candle ranges.
How It Works:
• For each new candle, the script calculates the "center" price based on the user's Line Position selection.
• If showLines is enabled and (if applicable) the bullish engulfing condition is met, a new line is drawn from the current candle's bar_index at the calculated _center price, extending lineLength candles forward.
• The line's color is determined by whether the candle is bullish (close > open) or bearish (close < open).
• Opacity is calculated dynamically: scaledOpacity = int((100 - maxUserOpacity) * (1 - dynamicFactor) + maxUserOpacity), where dynamicFactor is candleSize / maxSize (current candle size relative to the max size in the last 20 candles). This means maxUserOpacity is the least transparent the line will be (for the largest candles), and smaller candles will have lines approaching full transparency.
• Optional price labels are added at the end of these lines.
• The script manages an array of drawn lines, removing the oldest ones if the maxLines limit is exceeded.
Potential Use Cases:
• Visualizing Intra-Candle Levels: Quickly see midpoints or other key price points without manual drawing.
• Short-Term Reference Points: The extended lines can act as very short-term dynamic support/resistance or points of interest.
• Pattern Recognition: Highlight bullish engulfing patterns or simply emphasize candles based on their calculated center.
• Volatility Indication: The dynamic opacity can subtly indicate periods of larger or smaller candle ranges.
• Confirmation Tool: Use in conjunction with other indicators or trading strategies.
User Input Groups:
• Line Settings: Controls all aspects of the line's appearance and calculation.
• Label Settings: Manages the display and appearance of price labels.
• Other Settings: Contains options for line management and conditional filtering (like Bullish Engulfing).
This indicator provides a clean and customizable way to mark significant price levels within candles, aiding traders in their technical analysis.
Note di rilascio
GCM Centre Line Candle Marker (GCM-CLCM)Overview:
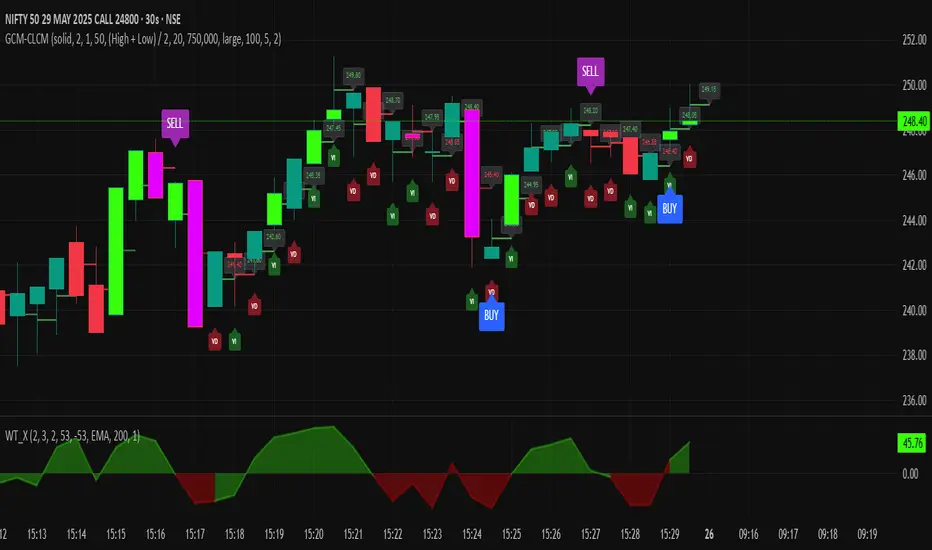
The "GCM Centre Line Candle Marker" is a comprehensive, multi-feature TradingView indicator designed to enhance chart analysis by providing a rich set of visual cues directly on your price chart. It combines price action analysis, volume interpretation, and pivot point signals into one versatile tool.
Key Features:
Customizable Center Lines:
Draws a horizontal line on each candle at a user-defined center point (e.g., (High+Low)/2, (Open+Close)/2, Close, Open, HLCO/4, etc.).
Dynamic Visuals: Line style (solid, dotted, dashed), width, length (extension onto future bars), and opacity (dynamically adjusted based on candle size relative to recent candles) are all configurable.
Conditional Drawing: Option to display center lines only for Bullish Engulfing patterns.
Color Coding: Separate base colors for bullish and bearish candle center lines.
Center Line Price Labels:
Displays the exact price level of each center line for quick reference.
Customizable label background color.
Dynamic Text Color: Text color can change based on whether the current center price is above or below the previous one (green for up, red for down), or a static color can be used.
Volume-Based Candle Body Highlighting:
Highlights the body of candles when their volume exceeds a user-defined Simple Moving Average (SMA) of volume.
Custom Colors: Specific colors (#37ff0c for bullish, #e200ff for bearish by default) make these significant volume candles stand out.
Volume MA length is configurable.
High Volume Crown Emojis:
Places a "👑" emoji on candles whose volume surpasses a user-defined threshold (default: 750,000).
Emojis appear below bullish candles and above bearish candles, visually flagging exceptionally high volume activity.
VI/VD (Volume Increased/Decreased) Labels:
Adds small "VI" or "VD" labels below candles to indicate changes in volume compared to the previous candle.
"VI" (Volume Increased): Green background (#1b5e20), white text.
"VD" (Volume Decreased): Red background (#801922), white text.
Provides an at-a-glance view of short-term volume dynamics.
Pivot Point "Next Candle" Signals:
Identifies pivot highs and lows based on configurable swingLeft and swingRight lookback periods.
BUY Signals: Plotted on the candle following a confirmed pivot low.
SELL Signals: Plotted on the candle following a confirmed pivot high.
Signal Alternation: Ensures signals alternate (e.g., a BUY won't plot if the last signal was also a BUY from a recent pivot) to reduce noise.
Customizable colors for BUY (blue) and SELL (purple) signal labels.
Option to plot the actual detected swing points (H/L) for verification.
Alert Conditions:
Big Bullish Candle: Triggers when a bullish candle's size is significantly larger than its recent average.
Pivot Next Candle Buy: Triggers when a "BUY" signal is generated from the pivot logic.
Pivot Next Candle Sell: Triggers when a "SELL" signal is generated from the pivot logic.
Performance Optimization:
Users can set a maximum number of historical center lines to display, helping to maintain chart performance.
How to Use:
Center Lines: Use as dynamic reference points, potential micro support/resistance, or to gauge candle midpoint momentum. The dynamic opacity can hint at the relative "strength" of a candle.
Volume Highlights & Crowns: Identify candles with significant institutional interest, potential breakouts, or exhaustion points.
VI/VD Labels: Quickly assess immediate volume flow bar-by-bar, complementing other volume analyses.
Pivot Signals: Consider these as potential entry or reversal points, especially when they align with other technical factors or the visual cues provided by this indicator (e.g., a pivot buy signal on a high-volume "VI" candle).
Confluence: The strength of this indicator lies in observing the confluence of its various signals. For example, a pivot signal accompanied by a volume crown and a favorable VI/VD reading might be considered more significant.
Customization:
The indicator offers extensive input settings, allowing traders to tailor every visual element and parameter to their specific trading style, strategy, and chart preferences.
Target Audience:
This tool is designed for price action traders, volume analysts, and those who utilize pivot points in their strategies. It's beneficial for anyone looking to add a layer of detailed, customizable visual information to their charts.
Disclaimer:
This indicator is for educational and informational purposes only and should not be considered financial advice. Trading financial markets involves substantial risk of loss. Past performance is not indicative of future results. Always conduct your own thorough research and analysis before making any trading decisions. The author is not responsible for any losses incurred from the use of this indicator.
Feel free to adjust any part of this description to better fit your style or any specific nuances you'd like to emphasize. Good luck with publishing your script!
Note di rilascio
GCM Centre Line Candle Marker (GCM-CLCM)Overview:
The "GCM Centre Line Candle Marker" is a comprehensive, multi-feature TradingView indicator designed to enhance chart analysis by providing a rich set of visual cues directly on your price chart. It combines price action analysis, volume interpretation, and pivot point signals into one versatile tool.
Key Features:
1. Customizable Center Lines:
o Draws a horizontal line on each candle at a user-defined center point (e.g., (High+Low)/2, (Open+Close)/2, Close, Open, HLCO/4, etc.).
o Dynamic Visuals: Line style (solid, dotted, dashed), width, length (extension onto future bars), and opacity (dynamically adjusted based on candle size relative to recent candles) are all configurable.
o Conditional Drawing: Option to display center lines only for Bullish Engulfing patterns.
o Color Coding: Separate base colors for bullish and bearish candle center lines.
2. Center Line Price Labels:
o Displays the exact price level of each center line for quick reference.
o Customizable label background color.
o Dynamic Text Color: Text color can change based on whether the current center price is above or below the previous one (green for up, red for down), or a static color can be used.
3. Volume-Based Candle Body Highlighting:
o Highlights the body of candles when their volume exceeds a user-defined Simple Moving Average (SMA) of volume.
o Custom Colors: Specific colors (#37ff0c for bullish, #e200ff for bearish by default) make these significant volume candles stand out.
o Volume MA length is configurable.
4. High Volume Crown Emojis:
o Places a "👑" emoji on candles whose volume surpasses a user-defined threshold (default: 750,000).
o Emojis appear below bullish candles and above bearish candles, visually flagging exceptionally high volume activity.
5. VI/VD (Volume Increased/Decreased) Labels:
o Adds small "VI" or "VD" labels below candles to indicate changes in volume compared to the previous candle.
o "VI" (Volume Increased): Green background (#1b5e20), white text.
o "VD" (Volume Decreased): Red background (#801922), white text.
o Provides an at-a-glance view of short-term volume dynamics.
6. Pivot Point "Next Candle" Signals:
o Identifies pivot highs and lows based on configurable swingLeft and swingRight lookback periods.
o BUY Signals: Plotted on the candle following a confirmed pivot low.
o SELL Signals: Plotted on the candle following a confirmed pivot high.
o Signal Alternation: Ensures signals alternate (e.g., a BUY won't plot if the last signal was also a BUY from a recent pivot) to reduce noise.
o Customizable colors for BUY (blue) and SELL (purple) signal labels.
o Option to plot the actual detected swing points (H/L) for verification.
7. Alert Conditions:
o Big Bullish Candle: Triggers when a bullish candle's size is significantly larger than its recent average.
o Pivot Next Candle Buy: Triggers when a "BUY" signal is generated from the pivot logic.
o Pivot Next Candle Sell: Triggers when a "SELL" signal is generated from the pivot logic.
8. Performance Optimization:
o Users can set a maximum number of historical center lines to display, helping to maintain chart performance.
How to Use:
• Center Lines: Use as dynamic reference points, potential micro support/resistance, or to gauge candle midpoint momentum. The dynamic opacity can hint at the relative "strength" of a candle.
• Volume Highlights & Crowns: Identify candles with significant institutional interest, potential breakouts, or exhaustion points.
• VI/VD Labels: Quickly assess immediate volume flow bar-by-bar, complementing other volume analyses.
• Pivot Signals: Consider these as potential entry or reversal points, especially when they align with other technical factors or the visual cues provided by this indicator (e.g., a pivot buy signal on a high-volume "VI" candle).
• Confluence: The strength of this indicator lies in observing the confluence of its various signals. For example, a pivot signal accompanied by a volume crown and a favorable VI/VD reading might be considered more significant.
Customization:
The indicator offers extensive input settings, allowing traders to tailor every visual element and parameter to their specific trading style, strategy, and chart preferences.
Target Audience:
This tool is designed for price action traders, volume analysts, and those who utilize pivot points in their strategies. It's beneficial for anyone looking to add a layer of detailed, customizable visual information to their charts.
Disclaimer:
This indicator is for educational and informational purposes only and should not be considered financial advice. Trading financial markets involves substantial risk of loss. Past performance is not indicative of future results. Always conduct your own thorough research and analysis before making any trading decisions. The author is not responsible for any losses incurred from the use of this indicator.
Script open-source
Nello spirito di TradingView, l'autore di questo script lo ha reso open source, in modo che i trader possano esaminarne e verificarne la funzionalità. Complimenti all'autore! Sebbene sia possibile utilizzarlo gratuitamente, ricordiamo che la ripubblicazione del codice è soggetta al nostro Regolamento.
- uniGram
Declinazione di responsabilità
Le informazioni e le pubblicazioni non sono intese come, e non costituiscono, consulenza o raccomandazioni finanziarie, di investimento, di trading o di altro tipo fornite o approvate da TradingView. Per ulteriori informazioni, consultare i Termini di utilizzo.