PROTECTED SOURCE SCRIPT
Aggiornato Quan Money Flow

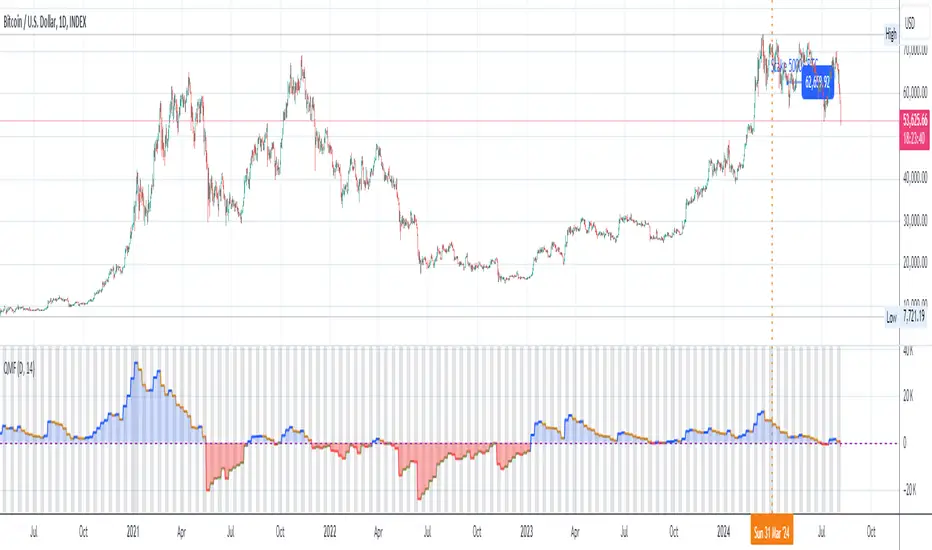
This indicator used to check the power in price and volume while the money going in and out of the market. It takes combination of price power, its direction and volume into consideration.
*** Can be used on long term chart (monthly or weekly) or even short-term one like daily, hourly chart.
*** Indicator colors:
- Red: trend down
- Green: trend up
*** Guide to use this indicator:
- Buy when it is under 0 and starts going up.
- Be hesitate to buy when the indicator is over 0, as your risk is big and the reward is low.
- Always put a stop when you go in the market, as NO indicator can guarantee you 100% correct all the time.
Note di rilascio
Updated to USD/JPY to have longer view in term of time.Note di rilascio
Updated UI.Updated buy and sell signal logic.
Note di rilascio
Add option to use a test price instead of current close price.Note di rilascio
Update view.Note di rilascio
Update short name.Note di rilascio
Update price text.Note di rilascio
Update chart.Note di rilascio
Add resolution to reduce the noise of each bar (you still can use the original timeframe if you want too).Can use in any timeframe (5m, 15m, 1H, 1D, 1W, ...) to see the trend.
Note: this script has a small side affect of repainting as it uses resolution. Thus, you might want to wait a little bit before entering a trade.
Note di rilascio
Add option to reduce the repainting issue.Note di rilascio
Enhance auto resolution.Auto choose source now.
Script protetto
Questo script è pubblicato come codice protetto. Tuttavia, è possibile utilizzarle liberamente e senza alcuna limitazione – ulteriori informazioni qui.
Declinazione di responsabilità
Le informazioni e le pubblicazioni non sono intese come, e non costituiscono, consulenza o raccomandazioni finanziarie, di investimento, di trading o di altro tipo fornite o approvate da TradingView. Per ulteriori informazioni, consultare i Termini di utilizzo.