OPEN-SOURCE SCRIPT
Linear Regression Slope - Version 2
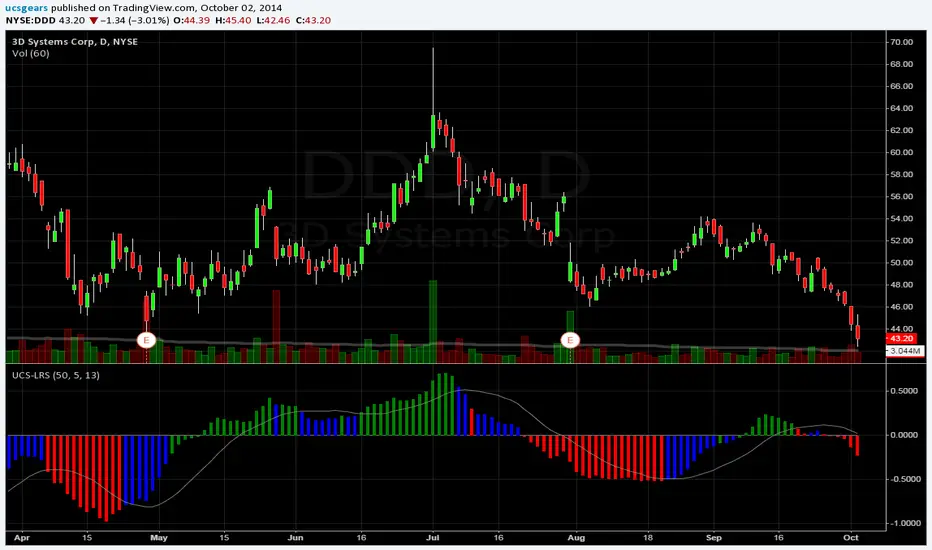
Version 2 - Linear Regression Slope. This version will have more freedom on picking your own length for all the Inputs.
One of the main reason I changed it is because, Slope calculation on transition period was not being computed properly. Because the Version 1, looks back the length assigned, and compute the slope based on two candle readings, could be 10 days apart or 50. That was misleading.
Therefore, I changed it to plot daily slope and Smooth it with an EMA.
Linear Regression Curve - tradingview.com/v/JojPxTRD/
List of All my Indicators - tradingview.com/p/stocks/?sort=recent&time=day&by=ucsgears
Script open-source
In pieno spirito TradingView, il creatore di questo script lo ha reso open-source, in modo che i trader possano esaminarlo e verificarne la funzionalità. Complimenti all'autore! Sebbene sia possibile utilizzarlo gratuitamente, ricorda che la ripubblicazione del codice è soggetta al nostro Regolamento.
Uday C Santhakumar
Declinazione di responsabilità
Le informazioni ed i contenuti pubblicati non costituiscono in alcun modo una sollecitazione ad investire o ad operare nei mercati finanziari. Non sono inoltre fornite o supportate da TradingView. Maggiori dettagli nelle Condizioni d'uso.