PROTECTED SOURCE SCRIPT
Babil34 VOLX
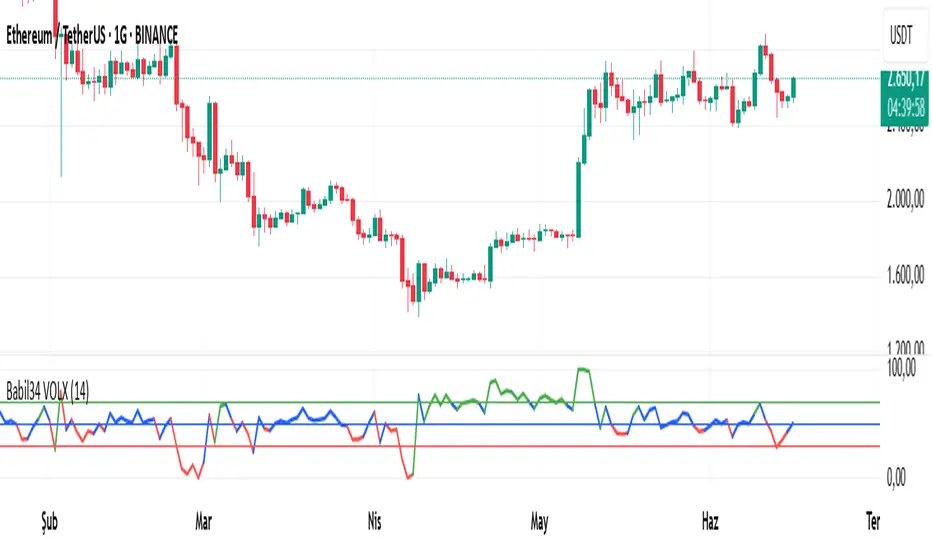
The VOLX Indicator is designed to measure the directional impact of trading volume on price action. Unlike traditional volume indicators that typically focus only on the absolute value of volume, this indicator aims to analyze not just the magnitude of volume, but also the strength and direction of its relationship with price movement—both numerically and visually.
Operating Principle
Adaptive Period Structure
The indicator automatically detects the chart’s timeframe and dynamically adjusts the analysis period accordingly. This eliminates the need for users to manually configure period settings.
Unless a custom period is entered by the user, the indicator applies the following default periods:
Monthly chart: 18 bars
Weekly chart: 30 bars
Daily chart: 21 bars
All other intraday/custom timeframes: 14 bars
This structure ensures consistent and stable performance across various timeframes. When the automatic setting is disabled, users can manually define the period, and the indicator will operate based on that value.
Volume Normalization: Quantifying Volume Pressure
The current volume is divided by the moving average of volume over the selected period to produce a normalized ratio. This ratio expresses the relative strength of volume compared to its recent average.
The resulting value is capped at a predefined maximum threshold to prevent extreme values from distorting the analysis, yielding a volume strength coefficient constrained within the 0–1 range.
Price Reaction Calculation: Volume-Price Interaction
Price reaction is calculated as follows:
The intraday price range is divided by the closing price to compute percentage volatility.
The difference between the close and open prices determines direction (positive or negative).
Multiplying these two elements produces a directional price response.
This response value is restricted within a -0.1 to +0.1 range to smooth out extreme fluctuations, resulting in more readable and comparable outputs.
The product of volume strength and price response forms a raw composite score, allowing the indicator to remain sensitive to immediate changes while filtering out excessive market noise.
Visual Presentation
The indicator line is color-coded based on the directional impact of volume on price:
Green: Volume is pushing the price upward
Red: Volume is pulling the price downward
Blue: Neutral or weak effect
Reference lines:
70: Strong buying pressure
50: Neutral zone
30: Strong selling pressure
This color system allows users to instantly interpret the directional influence of volume at a glance.
Intended Use Cases
Understand the directional impact of volume on price
Detect buying and selling pressure at an early stage
Filter out misleading (fake) signals
Add a volume-based confirmation layer to other technical indicators
Analyze volume dynamics in short- or long-term strategies
Note: This indicator is not financial advice. For best results, it is recommended to use it alongside other technical analysis tools.
Script protetto
Questo script è pubblicato come codice protetto. Tuttavia, è possibile utilizzarle liberamente e senza alcuna limitazione – ulteriori informazioni qui.
Declinazione di responsabilità
Le informazioni e le pubblicazioni non sono intese come, e non costituiscono, consulenza o raccomandazioni finanziarie, di investimento, di trading o di altro tipo fornite o approvate da TradingView. Per ulteriori informazioni, consultare i Termini di utilizzo.