Supply & Demand Trade Analyzer by NYTC

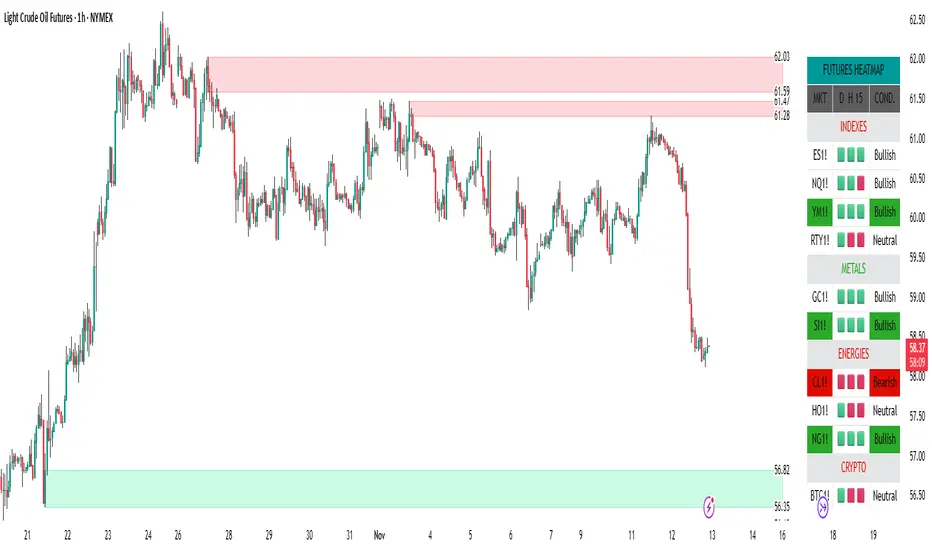
Automatic Zone Identification
• Identifies high quality supply and demand zones on multiple timeframes
• Shows the prices for each zone so the user may easily identify actionable prices to buy or sell
• Once a zone is no longer valid, it is automatically removed from the chart to keep the workspace clean.
• Includes all 4 zone formations: DBR, RBR, RBD and DBD
What are supply and demand zones?
Supply and demand zones are visual representations of areas where there has been a price imbalance. Whenever a demand imbalance is detected, the indicator will plot a green demand zone which may be used as an area to buy under the right market conditions, such as an uptrend or to take profit on a short position. Also, whenever a supply imbalance is detected, the indicator will plot a red supply zone which may be used as an area to sell under the right conditions such as a downtrend or to take profit on a long position.
Automatic Trend Analysis
Proper trend analysis is one of the most important steps in successfully trading or investing in the financial markets as it helps the trader determine which side of the market, he/she wants to take: long or short. For this reason, we decided to also include in this indicator our unique trend analysis technique that utilizes highs and lows to detect when trends begin, how they continue and when they end. The indicator is able properly identify uptrends (Higher Highs and Higher Lows), downtrend (Lower Highs and Lower Lows), and sideways trends (relatively equal highs and lows, higher highs but lower lows or lower highs but higher lows).
• The trader can toggle this feature on or off as needed.
• Our unique trend indicator is located at the bottom of the chart so, as not to interfere with the candles and hide important information.
• When the indicator shows green, the trend is up, when it shows red, the trend is down and sideways when the indicator shows grey.
How it works
Being that supply and demand zones are areas of potential imbalance, under the right conditions price may reverse at these zones. Use them in conjunction with your entry and exit rules to maximize efficacy and minimize risk.
User Inputs
In the settings menu you will find the following functions:
• Zone Count: Allows the trader to determine how many zones are shown on the chart
• Zone-on-Zone: Give the trader the option to also see overlapping zones
• Minor Zones: While the indicator plots major zones by default, this function gives the trader to see all zones in real time as they are being formed.
• HTF Trend: Give the trader the option to turn on our unique trend identification tool
• LTF Momentum: Allows the trader to toggle on or off our unique lower timeframe momentum finder. This tool is best used during the Globex of the Futures session for short-term trading (scalping)
Instruments
Our Trade Analyzer works across all asset classes and on all instruments, including:
Stocks
Futures
Forex
Cryptocurrencies
Summary
The Supply and Demand Trade Analyzer offers traders a quick and easy way of identifying supply and demand or support and resistance areas on a chart. It provides:
• Zone Identification: Proper zone identification on multiple timeframes
• User-Friendly Customization: With a variety of user inputs, you can tailor the analyzer to fit your unique trading strategy.
• Cross-Asset Compatibility: Works seamlessly across all major asset classes and instruments.
• Clean Workspace: Automatic removal of invalid zones keeps your chart organized and focused on the most relevant information.
• Real-Time Insights: Stay ahead of the market with real-time zone plotting and trend analysis, enabling timely and strategic trades.
This important update gives the user options to:
1. Choose zone color preferences
2. Choose which timeframe trend to display on the current chart
3. Change trend indicator colors
4. A color has also been added to the trend indicator for sideways trends
- Multiple TF Trend Analysis
- Bullish/Bearish signal in the top right corner of the chart based on multiple trend combinations
The heatmap can be turn on/off. The ATR section can also be turned on/off leaving just the heatmap visible.
Trend Zones
Heatmap
Script su invito
Solo gli utenti approvati dall'autore possono accedere a questo script. È necessario richiedere e ottenere l'autorizzazione per utilizzarlo. Tale autorizzazione viene solitamente concessa dopo il pagamento. Per ulteriori dettagli, seguire le istruzioni dell'autore riportate di seguito o contattare direttamente NewYorkTradersClub.
TradingView NON consiglia di acquistare o utilizzare uno script a meno che non si abbia piena fiducia nel suo autore e se ne comprenda il funzionamento. È inoltre possibile trovare alternative gratuite e open source nei nostri script della community.
Istruzioni dell'autore
Declinazione di responsabilità
Script su invito
Solo gli utenti approvati dall'autore possono accedere a questo script. È necessario richiedere e ottenere l'autorizzazione per utilizzarlo. Tale autorizzazione viene solitamente concessa dopo il pagamento. Per ulteriori dettagli, seguire le istruzioni dell'autore riportate di seguito o contattare direttamente NewYorkTradersClub.
TradingView NON consiglia di acquistare o utilizzare uno script a meno che non si abbia piena fiducia nel suo autore e se ne comprenda il funzionamento. È inoltre possibile trovare alternative gratuite e open source nei nostri script della community.