Square of Nine Levels [RC] Advance
The Square of Nine Levels [RC] indicator is a powerful price-projection and level-mapping tool based on W.D. Gann’s legendary Square of Nine mathematical system. This indicator transforms market prices into geometric rotations and harmonic levels—revealing price zones where markets historically accelerate, pause, or reverse with uncanny accuracy.
Unlike static Fibonacci tools, Square of Nine levels expand radially around a chosen base price, creating concentric price cycles that align with vibrational mathematics, planetary motion analogies, and cyclical market resonance. When price interacts with these rotational degrees, traders often witness structural reactions that are invisible to standard indicators.
🧭 What This Indicator Does
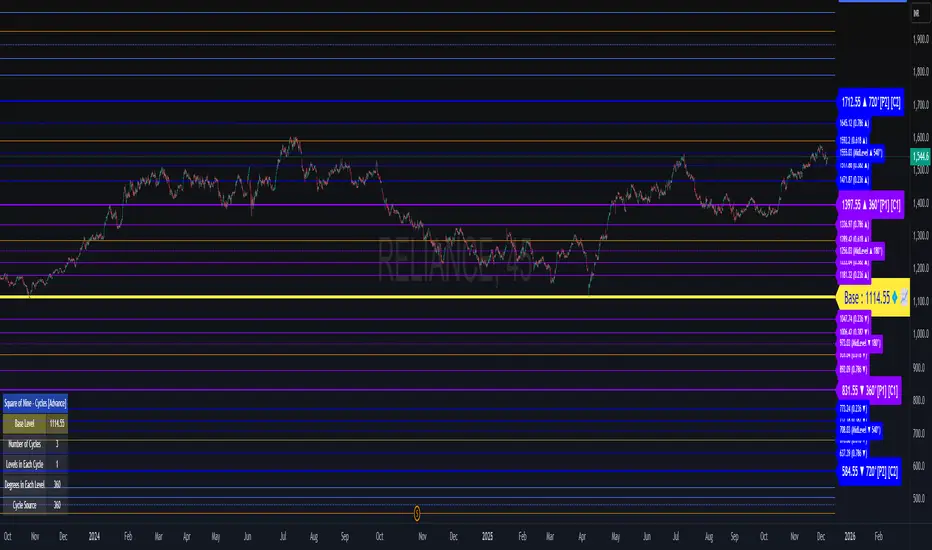
Once a trader inputs (or clicks) a Base Price, the indicator automatically:
✔️ Computes Square of Nine projections in upward and downward directions
✔️ Plots concentric price circles (levels of expansion)
✔️ Highlights rotational harmonics and midpoint attractors
✔️ Shows Golden Ratio (0.618 / 0.382) cyclic divisions
✔️ Provides clear visual level markers & labels for analysis
✔️ Adjusts dynamically as price trends evolve
These levels act as mathematical magnets, where price frequently:
Finds hidden support or resistance
Creates fair value rejection zones
Forms breakout thresholds
Completes wave and time cycles
Resonates with prior swing pivots
🔍 Key Features
Feature Benefit
_________________________________________________________________________
Auto Square-of-Nine Level Calculation Zero manual computation—instant geometry
Adjustable Circles & Points Model Gann expansions as per your theory
Golden Ratio & Midpoint Zones Adds confluence for precision entries
Multi-color Cycle Layers Instantly differentiate price cycles
Minimal UI Designed for professional clean charts
🧠 Why the Square of Nine Matters
Gann believed that price does not move randomly—it rotates through degrees, harmonics, and vibrational frequencies. The Square of Nine captures this rotation mathematically:
Price in time equals price in space.
This tool reveals those rotational levels, allowing traders to anticipate when price is likely to pivot or continue—with mathematically predictable targets.
🎯 Best Use-Cases
Identifying major support/resistance levels
Timing cycle inflection points
Confluence with Wave Theory, SMC, FVGs, and geometry
Swing, positional, and index-level forecasting
If you trade using Gann methods, cycles, harmonics, Square of 9, or astro-geometry, this indicator becomes a foundational timing and projection engine.
🚀 Take Your Charting to the Next Dimension
The Square of Nine Levels [RC] is not just a level plotter—it is a market resonance system. Once you understand how price vibrates around these circles, you gain a structural edge that most traders never discover.
Script su invito
Solo gli utenti approvati dall'autore possono accedere a questo script. È necessario richiedere e ottenere l'autorizzazione per utilizzarlo. Tale autorizzazione viene solitamente concessa dopo il pagamento. Per ulteriori dettagli, seguire le istruzioni dell'autore riportate di seguito o contattare direttamente raikarcapital.
TradingView NON consiglia di acquistare o utilizzare uno script a meno che non si abbia piena fiducia nel suo autore e se ne comprenda il funzionamento. È inoltre possibile trovare alternative gratuite e open source nei nostri script della community.
Istruzioni dell'autore
Declinazione di responsabilità
Script su invito
Solo gli utenti approvati dall'autore possono accedere a questo script. È necessario richiedere e ottenere l'autorizzazione per utilizzarlo. Tale autorizzazione viene solitamente concessa dopo il pagamento. Per ulteriori dettagli, seguire le istruzioni dell'autore riportate di seguito o contattare direttamente raikarcapital.
TradingView NON consiglia di acquistare o utilizzare uno script a meno che non si abbia piena fiducia nel suo autore e se ne comprenda il funzionamento. È inoltre possibile trovare alternative gratuite e open source nei nostri script della community.