OPEN-SOURCE SCRIPT
Aggiornato Rocky's Dynamic DikFat Supply & Demand Zones
Dynamic Supply & Demand Zones
Overview
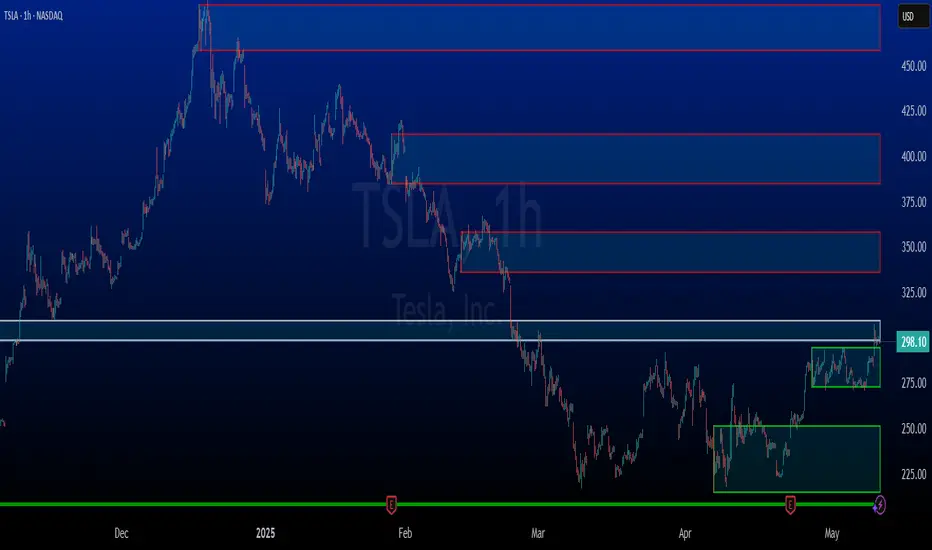
The Dynamic Supply & Demand Zones indicator identifies key supply and demand levels on your chart by detecting pivot highs and lows. It draws customizable boxes around these zones, helping traders visualize areas where price may react. With flexible display options and dynamic box behavior, this tool is designed to assist in identifying potential support and resistance levels for various trading strategies.
Key Features
How It Works
Inputs
How to Use
Understanding Supply and Demand in Stock Trading
In stock trading, supply and demand are fundamental forces driving price movements. Demand refers to the willingness of buyers to purchase a stock at a given price, often creating support levels where buying interest prevents further price declines. Supply represents the willingness of sellers to offload a stock, forming resistance levels where selling pressure halts price increases. These zones are critical because they highlight areas where significant buying or selling activity has occurred, influencing future price behavior.
The importance of supply and demand lies in their ability to reveal where institutional traders, with large orders, have entered or exited the market. Demand zones, often seen at pivot lows, indicate strong buying interest and potential areas for price reversals or bounces. Supply zones, typically at pivot highs, signal heavy selling and possible reversal points for downward moves. By identifying these zones, traders can anticipate where price is likely to stall, reverse, or break out, enabling better entry and exit decisions. This indicator visualizes these zones as dynamic boxes, making it easier to spot high-probability trading opportunities while emphasizing the core market dynamics of supply and demand.
Feedback
This indicator is designed to help traders visualize supply and demand zones effectively. If you have suggestions for improvements, please share your feedback in the comments!
Overview
The Dynamic Supply & Demand Zones indicator identifies key supply and demand levels on your chart by detecting pivot highs and lows. It draws customizable boxes around these zones, helping traders visualize areas where price may react. With flexible display options and dynamic box behavior, this tool is designed to assist in identifying potential support and resistance levels for various trading strategies.
Key Features
- Pivot-Based Zones: Automatically detects supply (resistance) and demand (support) zones using pivot highs and lows on the chart’s timeframe.
- Dynamic Box Sizing: Boxes shrink when price enters them, reflecting reduced zone strength, and stop adjusting once price fully crosses through.
- Customizable Display: Choose to show current-day boxes, historical boxes, or all boxes, with an option to update past box colors dynamically.
- Session-Based Extension: Boxes can extend to the current bar or stop at 4:00 PM of the creation day’s 9:30 AM–4:00 PM trading session (ideal for stock markets).
- Color Coding: Borders change color based on price position:
Green for demand zones (price above the box).
Red for supply zones (price below the box).
White for neutral zones (price inside the box). - User-Friendly Inputs: Adjust pivot lookback periods, box visibility, extension behavior, and colors via intuitive input settings.
How It Works
- Zone Detection: The indicator uses pivot highs and lows to define supply and demand zones, plotting boxes between these levels.
- Box Behavior:
Boxes are created when pivot highs and lows are confirmed, with no overlap with the previous box.
When price enters a box, it shrinks to reflect interaction, stopping once price exits completely.
Boxes can extend to the current bar or end at 4:00 PM of the creation day (or next trading day if created after 4:00 PM or on weekends). - Display Options:
Current Only: Shows boxes created on the current day.
Historical Only: Shows boxes from previous days, with optional color updates.
All Boxes: Shows all boxes, with an option to hide historical box color updates. - Performance: Limits the number of boxes to 200 to ensure smooth performance, removing older boxes as needed.
Inputs
- Pivot Look Right/Left: Set the number of bars (default: 2) to confirm pivot highs and lows.
- What Boxes to Show: Select Current Only, Historical Only, or All Boxes (default: Current Only).
- Boxes On/Off: Toggle box visibility (default: on).
- Extend Boxes to Current Bar: Choose whether boxes extend to the current bar or stop at 4:00 PM (default: off, stops at 4:00 PM).
- Update Past Box Colors: Enable/disable color updates for historical boxes (default: on).
- Demand/Supply/Neutral Box Color: Customize border colors (default: green, red, white).
How to Use
- Add the indicator to your chart.
- Adjust inputs to match your trading style (e.g., pivot lookback, box extension, colors).
- Use the boxes to identify potential support (demand) and resistance (supply) zones:
Green-bordered boxes (price above) may act as support.
Red-bordered boxes (price below) may act as resistance.
White-bordered boxes (price inside) indicate active price interaction. - Combine with other analysis tools (e.g., trendlines, indicators) to confirm trade setups.
- Monitor box shrinking to gauge zone strength and watch for breakouts when price fully crosses a box.
Understanding Supply and Demand in Stock Trading
In stock trading, supply and demand are fundamental forces driving price movements. Demand refers to the willingness of buyers to purchase a stock at a given price, often creating support levels where buying interest prevents further price declines. Supply represents the willingness of sellers to offload a stock, forming resistance levels where selling pressure halts price increases. These zones are critical because they highlight areas where significant buying or selling activity has occurred, influencing future price behavior.
The importance of supply and demand lies in their ability to reveal where institutional traders, with large orders, have entered or exited the market. Demand zones, often seen at pivot lows, indicate strong buying interest and potential areas for price reversals or bounces. Supply zones, typically at pivot highs, signal heavy selling and possible reversal points for downward moves. By identifying these zones, traders can anticipate where price is likely to stall, reverse, or break out, enabling better entry and exit decisions. This indicator visualizes these zones as dynamic boxes, making it easier to spot high-probability trading opportunities while emphasizing the core market dynamics of supply and demand.
Feedback
This indicator is designed to help traders visualize supply and demand zones effectively. If you have suggestions for improvements, please share your feedback in the comments!
Note di rilascio
Converted code to Pinescript V6. Corrected color initialization settings. Note di rilascio
Corrected border color opacity change to work correctly. Note di rilascio
Updated Default Settings. Note di rilascio
Added Multi-Time Frame Plotting Capability.Script open-source
Nello spirito di TradingView, l'autore di questo script lo ha reso open source, in modo che i trader possano esaminarne e verificarne la funzionalità. Complimenti all'autore! Sebbene sia possibile utilizzarlo gratuitamente, ricordiamo che la ripubblicazione del codice è soggetta al nostro Regolamento.
All opinions while deemed valid by its operators and shared on this board are not financial advice and are primarily for Entertainment Purposes.
Declinazione di responsabilità
Le informazioni e le pubblicazioni non sono intese come, e non costituiscono, consulenza o raccomandazioni finanziarie, di investimento, di trading o di altro tipo fornite o approvate da TradingView. Per ulteriori informazioni, consultare i Termini di utilizzo.
Script open-source
Nello spirito di TradingView, l'autore di questo script lo ha reso open source, in modo che i trader possano esaminarne e verificarne la funzionalità. Complimenti all'autore! Sebbene sia possibile utilizzarlo gratuitamente, ricordiamo che la ripubblicazione del codice è soggetta al nostro Regolamento.
All opinions while deemed valid by its operators and shared on this board are not financial advice and are primarily for Entertainment Purposes.
Declinazione di responsabilità
Le informazioni e le pubblicazioni non sono intese come, e non costituiscono, consulenza o raccomandazioni finanziarie, di investimento, di trading o di altro tipo fornite o approvate da TradingView. Per ulteriori informazioni, consultare i Termini di utilizzo.