OPEN-SOURCE SCRIPT
Variance (Welford) [Loxx]
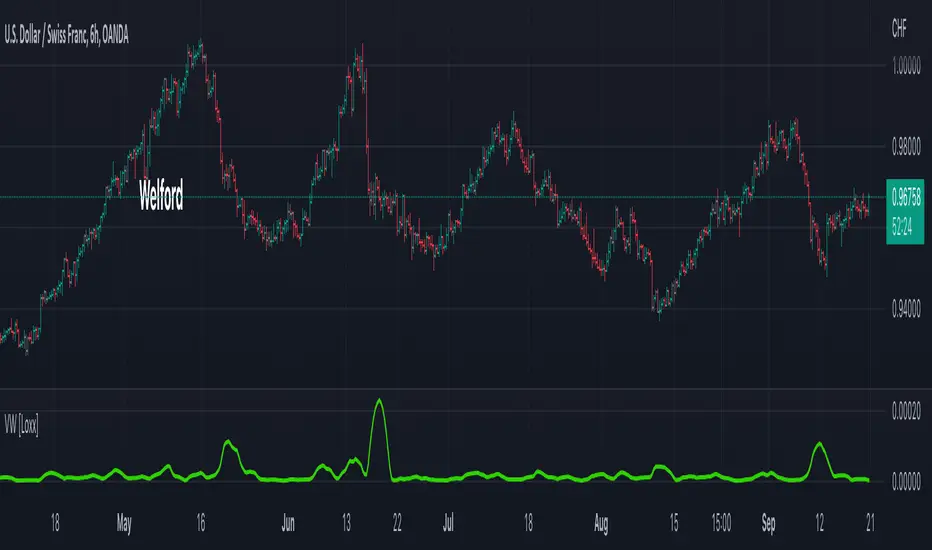
The standard deviation is a measure of how much a dataset differs from its mean; it tells us how dispersed the data are. A dataset that’s pretty much clumped around a single point would have a small standard deviation, while a dataset that’s all over the map would have a large standard deviation. You can. use this calculation for other indicators.
Given a sample the standard deviation is defined as the square root of the variance
Here you can find a Welford’s method for computing (single pass method) that avoids errors in some cases (if the variance is small compared to the square of the mean, and computing the difference leads catastrophic cancellation where significant leading digits are eliminated and the result has a large relative error)
Read more here: https://jonisalonen.com/2013/deriving-welfords-method-for-computing-variance/
Incliuded
- Loxx's Expanded Source Types
Script open-source
Nello spirito di TradingView, l'autore di questo script lo ha reso open source, in modo che i trader possano esaminarne e verificarne la funzionalità. Complimenti all'autore! Sebbene sia possibile utilizzarlo gratuitamente, ricordiamo che la ripubblicazione del codice è soggetta al nostro Regolamento.
Public Telegram Group, t.me/algxtrading_public
VIP Membership Info: patreon.com/algxtrading/membership
VIP Membership Info: patreon.com/algxtrading/membership
Declinazione di responsabilità
Le informazioni e le pubblicazioni non sono intese come, e non costituiscono, consulenza o raccomandazioni finanziarie, di investimento, di trading o di altro tipo fornite o approvate da TradingView. Per ulteriori informazioni, consultare i Termini di utilizzo.