OPEN-SOURCE SCRIPT
Session Fibonacci Levels [QuantVue]
The "Session Fibonacci Levels" indicator is a powerful tool designed for traders who aim to use Fibonacci retracement and extension levels in their trading strategy.
The indicator combines Fibonacci levels with customized trading sessions, allowing traders to observe and utilize Fibonacci levels that are automatically calculated for each defined session.
This approach offers a dynamic and session-relevant perspective on potential support and resistance levels, which can be crucial for intraday trading strategies.
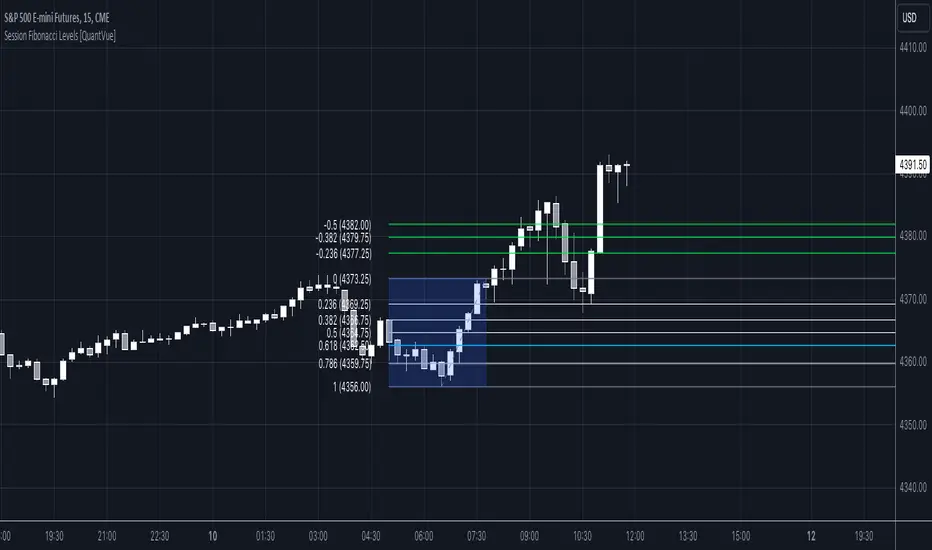
🔹The indicator calculates Fibonacci retracement and extension levels based on the high and low prices of a specified trading session, dynamically adjusting to the location of the high and low bar.

🔹Users can set their time zone and define trading sessions, allowing for flexibility and applicability across global markets. This is particularly beneficial for traders who focus on specific market hours like the London or New York sessions.
Important sessions:

🔹The indicator dynamically updates Fibonacci levels as new highs and lows are made within the session, keeping the analysis current. Additionally, it provides alerts when prices hit key Fibonacci levels, aiding in timely decision-making.
How to Use:

The indicator combines Fibonacci levels with customized trading sessions, allowing traders to observe and utilize Fibonacci levels that are automatically calculated for each defined session.
This approach offers a dynamic and session-relevant perspective on potential support and resistance levels, which can be crucial for intraday trading strategies.
🔹The indicator calculates Fibonacci retracement and extension levels based on the high and low prices of a specified trading session, dynamically adjusting to the location of the high and low bar.
- If the low of the session occurs before the high, the fib levels are measured from low to high.
- If the low of the session occurs after the high, the fib levels are measured from high to low.
🔹Users can set their time zone and define trading sessions, allowing for flexibility and applicability across global markets. This is particularly beneficial for traders who focus on specific market hours like the London or New York sessions.
Important sessions:
- New York (8:00am - 5:00pm EST)
- London (3:00am - 12:00pm EST)
- Asia (7:00pm - 4:00am EST)
- Custom session (user defined session in indicator settings)
🔹The indicator dynamically updates Fibonacci levels as new highs and lows are made within the session, keeping the analysis current. Additionally, it provides alerts when prices hit key Fibonacci levels, aiding in timely decision-making.
How to Use:
- Configure the time zone and session time
- Once the session begins, the indicator will begin highlighting the session range
- When the session ends, Fibonacci levels based on the high and low of the session will be drawn
- Use these levels to identify potential support and resistance areas
Script open-source
In pieno spirito TradingView, il creatore di questo script lo ha reso open-source, in modo che i trader possano esaminarlo e verificarne la funzionalità. Complimenti all'autore! Sebbene sia possibile utilizzarlo gratuitamente, ricorda che la ripubblicazione del codice è soggetta al nostro Regolamento.
Get Access to the exclusive QuantVue indicators: quantvue.io/
Join thousands of traders in our Free Discord: discord.gg/tC7u7magU3
Join thousands of traders in our Free Discord: discord.gg/tC7u7magU3
Declinazione di responsabilità
Le informazioni ed i contenuti pubblicati non costituiscono in alcun modo una sollecitazione ad investire o ad operare nei mercati finanziari. Non sono inoltre fornite o supportate da TradingView. Maggiori dettagli nelle Condizioni d'uso.